

설명
기능
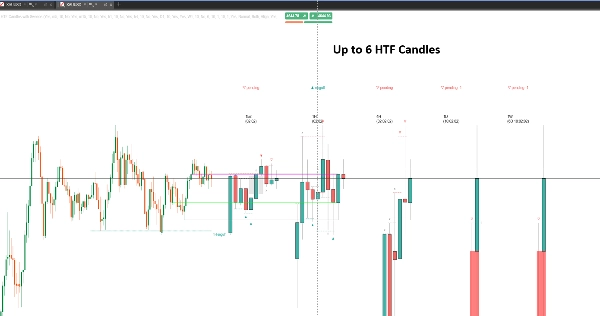
HTF Candles with Sweeps는 차트 옆에 실제 캔들로 최대 여섯 개의 상위 타임프레임을 표시합니다 — 5분, 15분, 1시간, 4시간, 일간, 주간 또는 선택한 해상도 — 따라서 상위 타임프레임의 상황이 거래 중인 가격 옆에 위치하여 차트를 전환하지 않고도 볼 수 있습니다.
이 캔들 위에는 유동성 스윕을 감지합니다: 뒤에 있는 고점이나 저점을 통과하여 그곳에 대기 중인 주문을 취하는 캔들입니다. 대부분의 도구는 단순히 스윕을 표시하는 데 그치지만, 이 도구는 이후 상황을 추적합니다. 왜냐하면 되찾은 스윕과 돌파로 이어진 스윕은 서로 반대의 의미를 가지기 때문입니다.
상위 타임프레임 패널
각각 고유한 타임프레임, 캔들 수, 색상을 가진 여섯 개의 독립 슬롯. 모든 세트는 적절한 몸통과 꼬리, 다음 마감까지의 실시간 카운트다운, 위아래의 타임프레임 라벨과 함께 그려집니다.
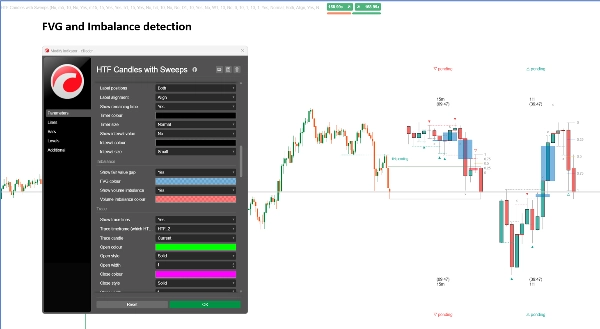
그려진 캔들 사이에는 공정 가치 갭과 거래량 불균형도 표시됩니다 — 이는 상위 타임프레임 차트 자체에서 읽을 수 있는 동일한 불균형으로, 차트를 열지 않고도 확인할 수 있습니다.
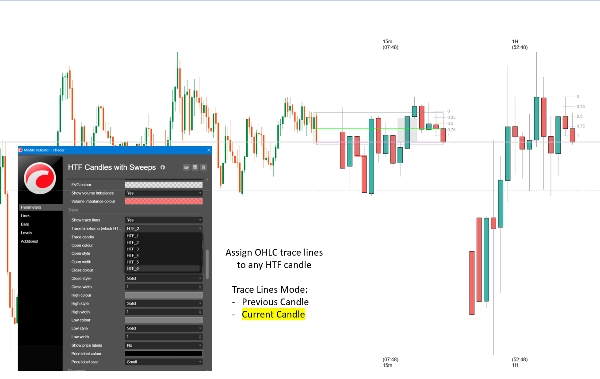
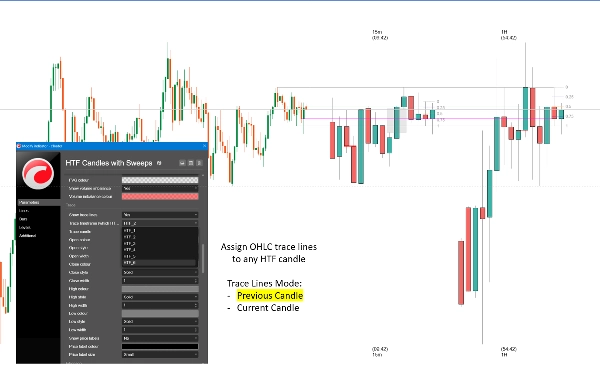
추적선은 선택한 타임프레임의 시가, 고가, 저가, 종가를 차트의 정확한 바에 연결하여 해당 레벨이 어디서 왔는지 볼 수 있게 합니다. 아직 형성 중인 캔들이나 마지막 완료된 캔들을 선택할 수 있습니다.
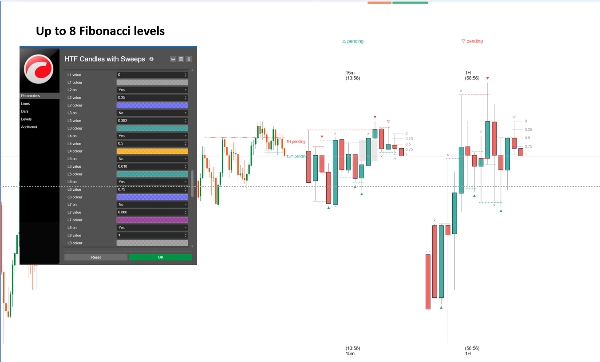
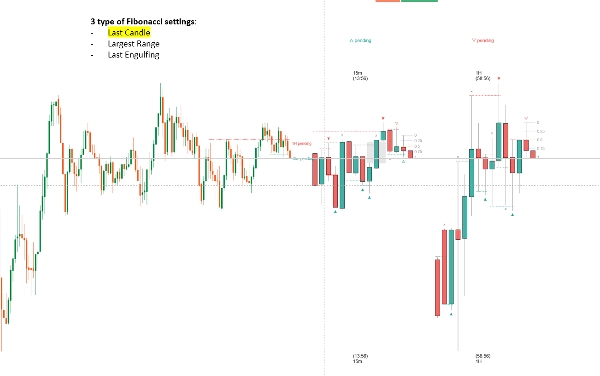
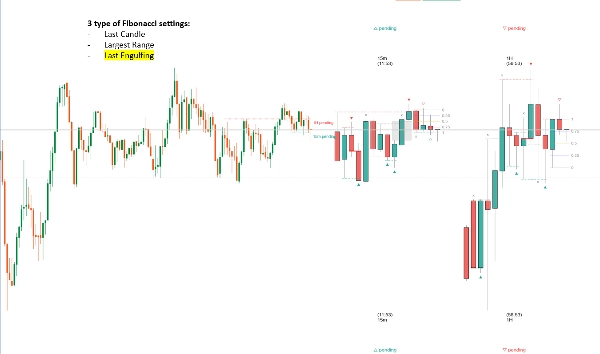
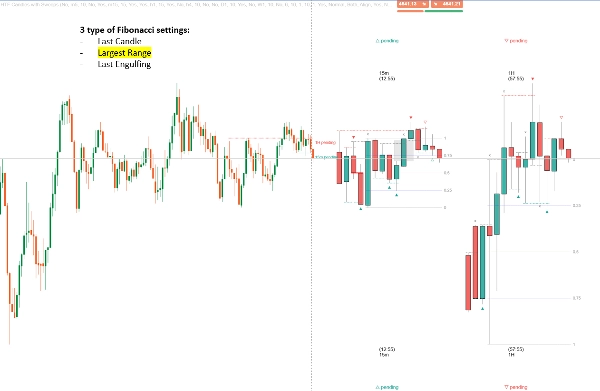
피보나치 레벨은 상위 타임프레임 캔들에서 투사되며, 8개의 구성 가능한 레벨과 스마트 앵커가 있어 캔들을 자동으로 선택합니다: 마지막 완료된 바, 화면에서 가장 넓은 고가-저가 캔들, 또는 가장 최근의 엔골핑 캔들 중에서 선택합니다.
유동성 스윕 감지
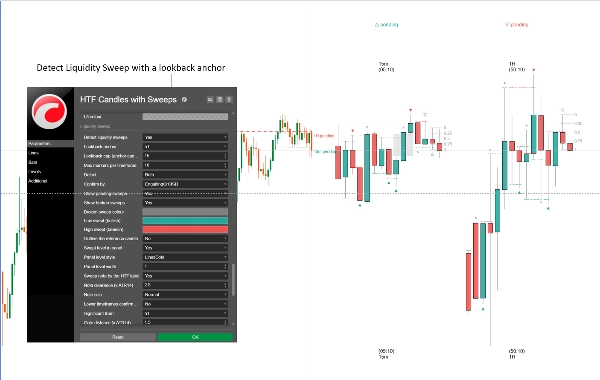
각 완료된 상위 타임프레임 캔들에 대해 엔진은 뒤로 거슬러 올라가 캔들이 실제로 돌파한 가장 높은 고점 또는 가장 낮은 저점을 찾으며, 돌파하지 못한 첫 번째 캔들에서 멈춥니다. 그 레벨이 스윕이 취한 수준입니다.
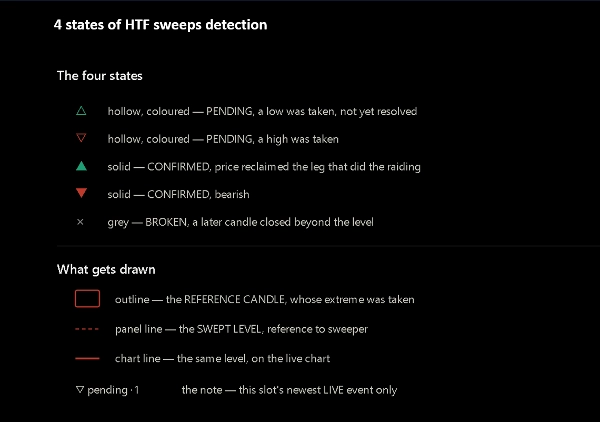
스윕은 네 가지 상태로 추적됩니다:
— 대기 중 — 레벨이 취해졌지만 아직 해결되지 않음
— CISD에 의해 확인됨 — 가격이 극단을 만든 구간의 시가를 다시 통과하여 마감됨
— 엔골핑에 의해 확인됨 — 이후 캔들의 몸통이 스윕 캔들을 삼키고 그 반대 방향으로 마감됨
— 돌파됨 — 이후 캔들이 레벨을 넘어 마감되어 돌파였음을 의미함
각 상태는 고유한 마커를 가지므로, 스윕한 캔들은 항상 이를 표시하며 마커는 결과를 알려줍니다. 리페인트가 없으며, 완료된 캔들만 평가되고 각 상태 변화는 마감 시 결정됩니다.
타임프레임 간 합류
하나의 회고 창은 앵커 타임프레임의 캔들로 표현되고 각 슬롯의 캔들 수로 변환되어, 15분 스윕과 1시간 스윕이 동일한 시장 범위 내에서 측정됩니다. 여러 타임프레임이 일치하면 실제로 동일한 이벤트를 설명하는 것입니다.
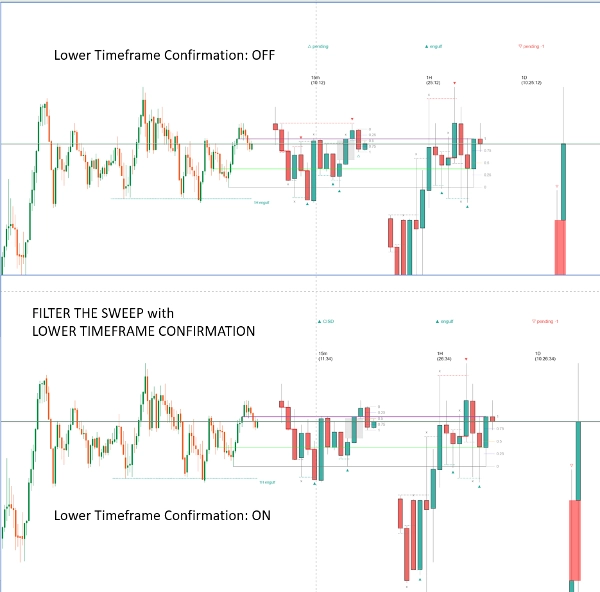
선택적 게이트는 이를 더 발전시킵니다: 사용자가 선택한 분할 아래의 타임프레임은 상위 타임프레임이 이미 동일한 방향과 유사한 가격에서 스윕을 보고할 때만 스윕을 보고합니다. 하위 타임프레임은 범위 노이즈 보고를 중단하고 더 큰 움직임을 확인하기 시작합니다.
차트에 표시된 스윕된 레벨
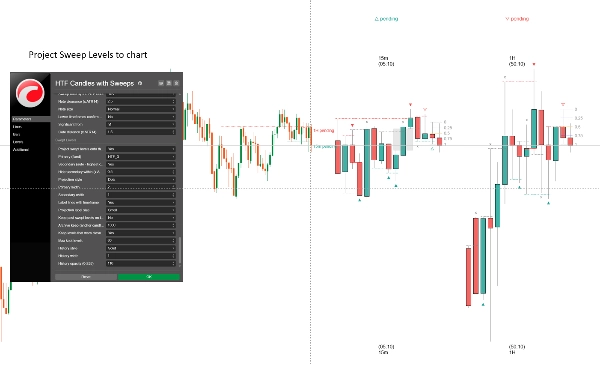
패널은 캔들을, 차트는 가격을 보여줍니다. 스윕된 레벨은 참조 캔들이 실제로 형성된 위치에서 현재까지 이어지는 수평선으로 그려지며, 타임프레임과 현재 상태가 라벨로 표시됩니다. 기본 라인은 고정한 타임프레임에서 나오며, 보조 라인은 현재 스윕된 가장 높은 다른 타임프레임으로 자동 채워집니다.
선택적 아카이브는 캔들이 패널에서 스크롤 아웃된 후에도 과거 스윕된 레벨을 차트에 유지하여 세션 전반에 걸친 감지 동작을 되돌아볼 수 있게 합니다.
일반적인 사용법
5분 또는 15분 차트에서 거래하면서 시간별 및 4시간 캔들이 옆에 표시됩니다. 상위 타임프레임이 레벨을 스윕하고 확인하면 방향과 작업할 가격이 생깁니다. 하위 타임프레임이 동의하면 합류가 발생합니다. 레벨이 깨질 경우 마커가 이를 알려주어 되돌림을 기다리지 않게 합니다.
유동성 스윕 및 스마트 머니 스타일 거래, 실패한 돌파 작업, 이전 고점과 저점을 중심으로 한 모든 접근법에 적합합니다. 외환, 지수, 금속 및 암호화폐에 유용합니다.
설정
— 여섯 개 타임프레임 슬롯, 각각 해상도, 캔들 수, 피보나치 토글 및 전체 스타일링 포함
— 패널 레이아웃: 가격에서의 패딩, 캔들 너비, 캔들 간 및 타임프레임 간 간격
— 라벨: 타임프레임 이름 상단 및 하단, 카운트다운 타이머, 간격 값, 크기 및 색상
— 불균형: 공정 가치 갭 및 거래량 불균형, 색상 조절 가능
— 추적선: 어떤 슬롯, 현재 또는 이전 캔들, 선별 색상, 스타일, 너비 및 가격 라벨
— 피보나치: 개별 값, 색상 및 토글이 있는 8개 레벨, 그리고 세 가지 스마트 앵커 모드
— 스윕 감지: 회고 앵커 및 한도, 방향, 확인 경로, 타임프레임별 마커 제한
— 대기 중, 확인됨 및 깨짐 상태에 대한 마커 외관
— 합류 게이트: 분할 타임프레임 및 거리 허용치
— 차트 투사: 기본 슬롯, 자동 보조, 스타일 및 라벨
— 아카이브: 앵커 캔들 내 보존, 최대 보관 수, 스타일링
대상 사용자
이미 상위 타임프레임의 고점과 저점을 기반으로 거래하는 일중 및 스윙 트레이더로, 차트 전환 없이 이를 보고 싶어하는 분들. 유동성 스윕이 무엇인지, 되찾기가 왜 중요한지 알고 있다고 가정합니다. 스윕이 차트 읽기의 일부가 아니라면 이 도구가 거래법을 가르치지 않습니다.
하지 않는 것
지금 명확히 하는 것이 나중에 시간을 절약합니다:
— 매수 또는 매도 신호, 진입, 손절 또는 목표 가격을 제공하지 않습니다
— 주문을 실행하지 않으며 계정에 접근할 수 없습니다 — 인디케이터는 전혀 접근 권한 없이 실행됩니다
— 알림이나 통지가 없습니다
— 예측하지 않습니다. 모든 마커는 이미 종료된 캔들을 설명합니다
— 리페인트하지 않습니다. 완료된 캔들만 평가하므로 마커는 이후에 변경되지 않습니다
— 전략이 아닙니다. 확인된 스윕은 가격이 어떻게 움직였는지 설명할 뿐, 어떻게 해야 하는지는 아닙니다
알아두면 좋은 점
감지는 각 슬롯이 실제로 그리는 캔들을 읽으므로 스윕은 항상 화면에 표시할 캔들이 있습니다.
슬롯의 캔들 수를 늘리면 뒤로 볼 수 있는 범위가 넓어집니다.
상위 타임프레임 캔들은 브로커 서버 시간에서 시작합니다. 동일한 종목의 두 브로커가 시간 또는 날짜를 다르게 구분할 수 있어, 동일한 심볼이 두 플랫폼에서 다르게 읽힐 수 있습니다. 이는 데이터의 특성이지 인디케이터의 오류가 아닙니다.
가장 최근에 종료된 캔들의 스윕은 대기 중 상태만 가질 수 있습니다 — 확인하려면 이후 캔들이 마감되어야 합니다. 일간 슬롯에서는 하루를 기다려야 합니다.
거래에는 위험이 따릅니다. 과거 성과가 미래 결과를 보장하지 않습니다.
요약
The indicator detects liquidity sweeps—candles that trade through previous highs or lows to capture resting orders—and tracks their resolution through four states: pending, confirmed by close inside the sweep’s range, confirmed by engulfing candle, or broken (breakout). These states are visually marked and only finalized on completed candles, ensuring no repainting.
Additional features include marking fair value gaps and volume imbalances between candles, trace lines linking higher timeframe candle levels to your chart, and configurable Fibonacci levels projected from selected higher timeframe candles with smart anchoring options.
Cross-timeframe confluence is supported by aligning sweep detection across multiple timeframes, with an optional gate to filter lower timeframe sweeps that confirm higher timeframe moves. Swept levels are drawn as horizontal lines on your chart with labels indicating timeframe and state, with an optional archive to retain past levels.
Designed for intraday and swing traders familiar with liquidity sweeps and higher timeframe analysis, it supports markets including forex, indices, metals, and crypto. The indicator does not provide trade signals, alerts, or order execution and operates solely as a visual analysis tool based on completed price data.
상담
고객 리뷰
자주 묻는 질문(FAQ)
이 작성자의 상품 더 보기




















가격
