present
가입하고 첫 구매 시 $50 할인을 받으세요
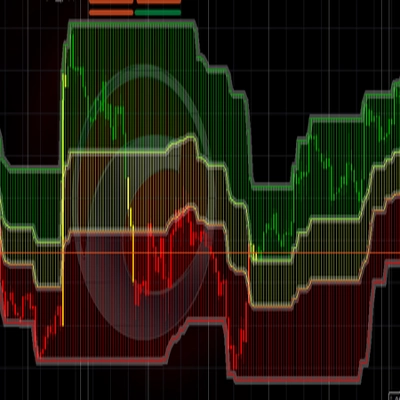
Trading product for Dynamic swing levels reader 지표 Fibonacci Fair Value Gap, image 1
Dynamic swing levels reader
지표
1 다운로드
버전 1.1, Nov 2026
Windows, Mac
Trading product for Dynamic swing levels reader 지표 Fibonacci Fair Value Gap, image 2
1
무료 설치

설명

Dynamic Swing Levels Reader - the companion to Flex Renko Inverse

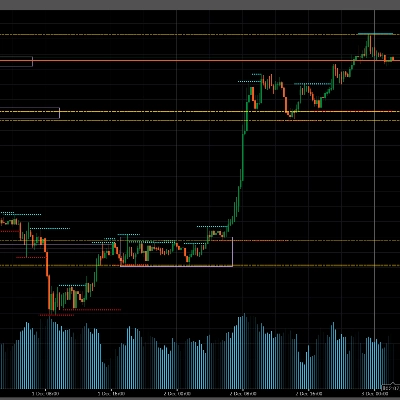
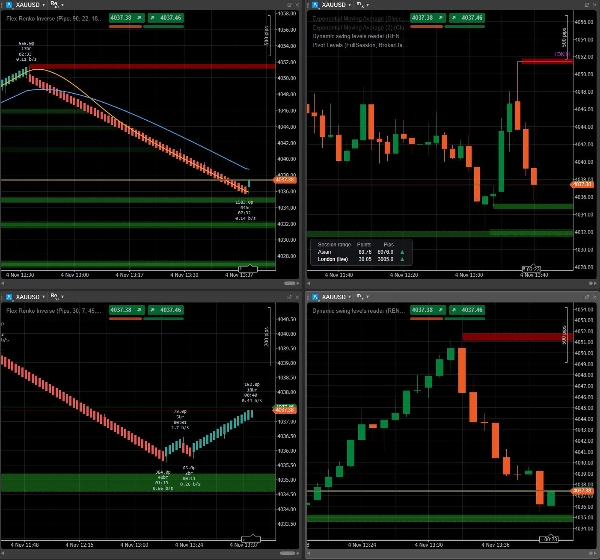
Flex Renko charts are excellent for spotting where the market really turned. Most traders, though, still execute on regular timeframe charts: M1, M5, H1. Dynamic Swing Levels Reader connects the two. It takes the swing zones from a Flex Renko Inverse chart and draws them, live, on any timeframe chart of the same symbol.


What "Requires Flex Renko Inverse" means

This indicator does not calculate anything by itself. It is a reader. The zones are created by Flex Renko Inverse, our main study, which builds renko bricks tick by tick and marks every confirmed reversal as a swing zone. Zones that price has not yet come back to are shared, and the Reader displays exactly those.

Without Flex Renko Inverse running on one of your charts, the Reader has nothing to show. That is why it is free: it extends the main study, it does not replace it.


How it works

  1. Open a Flex Renko Inverse chart and give it a name in "Instance name" (for example RENKO_CONTEXT)
  2. On any timeframe chart of the same symbol, add Dynamic Swing Levels Reader and type the same name in "Read swing levels from"
  3. That's it. The zones appear and stay in sync. When price reaches a zone it disappears from both charts, and new zones show up as soon as the renko chart creates them

Both charts must be open in cTrader on the same computer. If something is not connected (wrong name, different symbol, renko chart closed), the indicator tells you on the chart what is missing.


Why get Flex Renko Inverse

The swing zones are just one of its features. Flex Renko Inverse gives you:

  • Renko bricks built from real ticks, never from aggregated bars, with separate settings for trend continuation and reversal. Closed bricks never repaint
  • Swing zones with strength: the bigger the move that started from a turning point, the more visible its zone
  • Leg labels with the size, number of bricks, duration and speed of every swing, plus an arrow when the current leg is moving faster than usual
  • A rotation dashboard that shows, across 1, 5, 15 and 30 minutes, whether swings are getting wider or narrower and which side is in control
  • Moving averages calculated on bricks, not on hidden candles
  • The real time of every brick under your cursor

Use a slower renko as your context, share its zones, and trade them on the timeframe you are used to.


👉 Get Flex Renko Inverse: https://ctrader.com/products/5546

요약

AI 요약
Dynamic Swing Levels Reader is an indicator designed to display swing level zones generated by the Flex Renko Inverse study on any timeframe chart within cTrader. It functions as a companion tool that reads and visualizes swing zones created by Flex Renko Inverse, which builds Renko bricks tick-by-tick and identifies confirmed reversals as swing zones. These zones are shared live and synchronized between the Flex Renko Inverse chart and any other chart of the same symbol, allowing traders to view Renko-based swing levels on their preferred timeframe charts (e.g., M1, M5, H1).

To use it, a Flex Renko Inverse chart must be open and named; the Dynamic Swing Levels Reader then references this name to display the corresponding swing zones. Zones disappear once price revisits them, and new zones appear as the Renko chart updates. Both charts must be open simultaneously on the same computer.

Flex Renko Inverse offers advanced features including real-tick Renko bricks with separate trend and reversal settings, swing zones weighted by move strength, detailed leg metrics (size, duration, speed), a multi-timeframe rotation dashboard, and moving averages calculated on bricks. This setup enables traders to use slower Renko charts for market context while executing trades on their usual timeframe charts.

지표 프로필
지표 카테고리
지지 및 저항
출력 유형
시각화
데이터 요구 사항
막대만
외부 데이터
지원되는 신호
크로스
다이버전스
돌파
반전
추세 강도
변동성
레벨 터치
레벨 돌파

상담

고객 리뷰

0.0
리뷰: 0
고객 리뷰
이 상품에 대한 리뷰가 아직 없습니다. 이미 사용해 보셨나요? 다른 사람들에게 가장 먼저 소개해 주세요!

자주 묻는 질문(FAQ)

Fibonacci
Fair Value Gap
Key Levels
Order Block
Market Structure
Supply & Demand
Support & Resistance
트레이딩 봇, 지표, 플러그인 등 cTrader Store에서 제공되는 상품은 제3자 개발자에 의해 제공되며, 이는 단순히 정보 및 기술적 접근을 목적으로 제공된 것입니다. cTrader Store는 중개인이 아니며, 투자 조언, 개인별 추천 또는 향후 성과에 대한 어떠한 보장도 제공하지 않습니다.

이 작성자의 상품 더 보기

지표
Pin Bar
Order Block
+5
NEVER MISS A TREND & LET TRENDS RUN with Sierra Chart's Flex Renko Inverse, rebuilt for cTrader.
지표
Fibonacci
Key Levels
+5
Draws RTH, Asian, London, prior day/week, ORB, Floor and Camarilla pivot levels as rays, with a session range table.

좋아하실 만한 다른 항목

지표
ATR
VWAP
+17
Hybrid adaptive trend filter with clean Buy/Sell signals, dynamic bands and zero-repaint analysis.
지표
ATR
Trend-coloring Donchian cloud that highlights volatility squeezes and breakouts.
지표
AI
Prop
+8
The EMA Trend Simple is a trend-following tool designed for simplicity and visual clarity.
지표
MACD
Signal
Enhance your trading strategy with our customizable TradingViewMACD indicator. Optimize and elevate your market analysis
지표
AI
ATR
+23
The ZigZag Trend is a market structure tool that filters out small price fluctuations and highlights major swing.
지표
ATR
RSI
+13
The TrendFibonacci indicator is a powerful tool for traders, combining Fibonacci retracement levels
지표
ATR
BOS
+5
Opening ranges, dynamic trend channels, and multi-scale breakout/retest analysis for clear intraday chart decisions.
지표
Forex
BTCUSD
+9
synchronize scroll position and zoom levels across multiple charts. Perfect for multi-timeframe analysis
지표
Prop
Forex
+12
Introducing High Accuracy multi timeframe Swing high and low detector.
지표
Forex
Identify 34 candlestick patterns, track trends across timeframes, and get instant alerts with this powerful trading tool
지표
RSI
VWAP
+5
Trend direction, chart signals, reversal zones and volume tools in one configurable indicator.
지표
ATR
RSI
+2
This indicator works best as a trend-confirmation tool—wait for multiple signals!
지표
Signal
🔹 Trend-Reversal-Indicator for cTrader 🔹 The ultimate Renko chart tool!
지표
RSI
Fibonacci
+1
Spot RSI divergences on your chart and get an entry, stop and six targets when your filters line up.
지표
ADX
ATR
+5
10 Factors. One Signal. Zero Guesswork.
지표
Signal
New Trend whit buy-sell signal
지표
ATR
RSI
+7
Track the Movement of Market Assets with an Oscillator Scanner in Real-Time!
지표
ATR
Volume
+3
Volume profile key levels - POC, value area, volume peaks and troughs - with break, rejection and retest signals

가격

1
무료 설치