
Descrizione
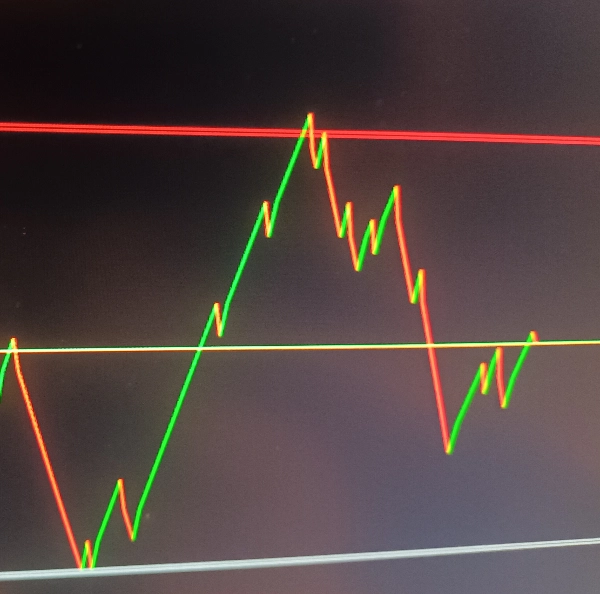
Visualizzazione della tendenza:
Disegna linee di tendenza (verde per tendenza al rialzo, rosso per tendenza al ribasso) basate sui cambiamenti di direzione del prezzo
Traccia una linea del prezzo gialla sul grafico
Zone di Supporto/Resistenza:
Livelli di supporto e resistenza configurabili con spessore regolabile (in pips)
Colori personalizzati e opacità per le zone
Zone interattive che possono essere regolate manualmente sul grafico
Sistema di Avvisi:
Avvisi di cambio tendenza (quando cambia la direzione del prezzo)
Avvisi di raggiungimento delle zone di supporto/resistenza
Avvisi sonori personalizzati per eventi diversi
Supporto/Resistenza Automatico:
Regolazione automatica opzionale dei livelli di supporto/resistenza quando cambiano le tendenze
Come Funziona
Imposta il timeframe selezionato (il default è Giornaliero)
livelli di supporto/resistenza con valori predefiniti o definiti dall'utente
Avvia un timer per controllare periodicamente gli aggiustamenti delle zone
Logica di Calcolo
Per ogni barra, confronta il prezzo di chiusura corrente con quello precedente
Determina la direzione attuale della tendenza (su/giù)
Disegna una linea di tendenza tra i prezzi corrente e precedente
Se la direzione della tendenza cambia:
Aggiorna opzionalmente i livelli di supporto/resistenza automaticamente
Attiva gli avvisi di tendenza (se abilitati)
Controlla se il prezzo entra nelle zone di supporto/resistenza e attiva gli avvisi di conseguenza
Gestione delle Zone
Le zone di supporto/resistenza sono disegnate come rettangoli semi-trasparenti
Le zone possono essere regolate manualmente sul grafico e l'indicatore terrà traccia di questi cambiamenti
Lo spessore della zona è configurabile in pips
Tipi di Avvisi
Avvisi di Tendenza: Attivati quando il prezzo cambia direzione (su/giù)
Avvisi di Zona: Attivati quando il prezzo entra nelle zone di supporto/resistenza
Avvisi di Livello Automatico: Quando il supporto/resistenza automatico è abilitato, avvisi quando questi livelli vengono regolati automaticamente
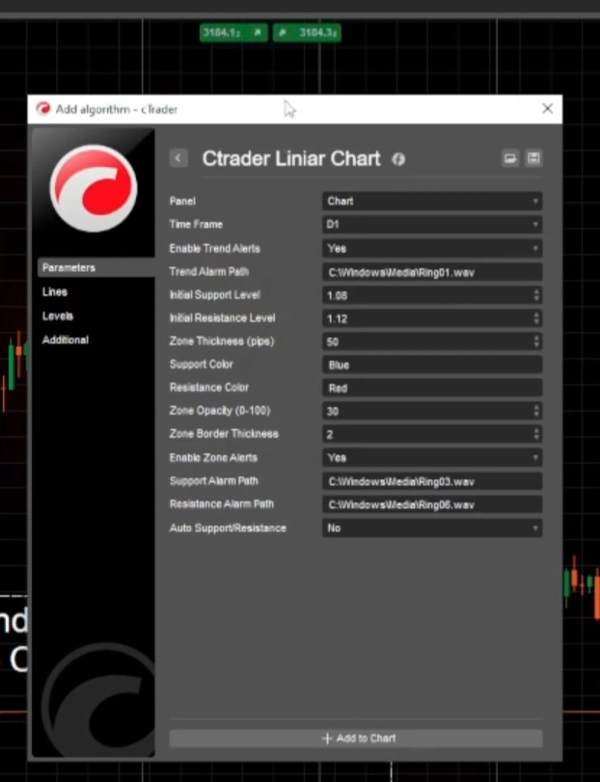
Selezione del timeframe
Abilita/disabilita diversi tipi di avvisi
Percorsi di file sonori personalizzati per diversi avvisi
Livello di supporto/resistenza .
Riepilogo
The indicator features configurable support and resistance zones displayed as semi-transparent rectangles, with adjustable thickness in pips, customizable colors, and opacity. These zones are interactive and can be manually adjusted on the chart, with the indicator tracking any changes.
An alert system notifies users of trend changes, price entries into support/resistance zones, and automatic adjustments of these levels if the auto-support/resistance feature is enabled. Alerts can be customized with different sound files and can be enabled or disabled individually.
The indicator periodically checks for zone adjustments and updates support/resistance levels automatically when trends change, if configured. It supports time frame selection and provides a comprehensive visual and alert-based approach to monitoring price trends and critical levels in trading charts.


