Açıklama
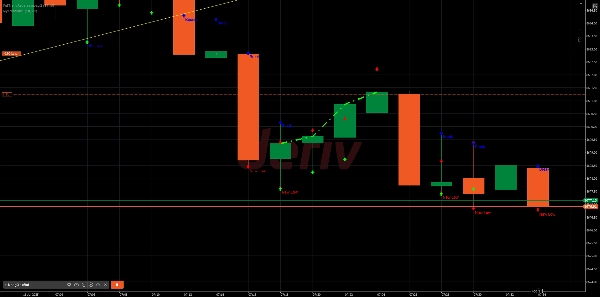
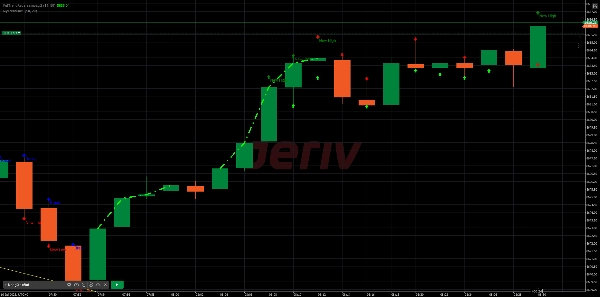
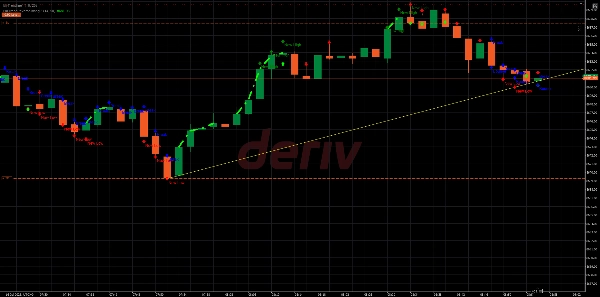
The MyTrendLine1, cTrader için özel bir trend çizgisi analiz göstergesidir ve tüccarların grafik üzerinde dinamik trend çizgileri çizerek önemli fiyat hareketi dönüş noktalarını belirlemelerine yardımcı olmak için tasarlanmıştır.
🔹 Temel özellikler:
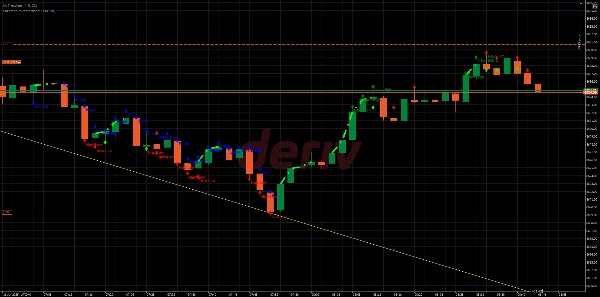
• Son yüksek ve düşük seviyelere göre otomatik olarak trend çizgileri çizer.
• Fiyatın trend çizgisine tepki verdiği sektirme noktalarını (mavi renkle) vurgular ve potansiyel devam ticaretlerini işaret eder.
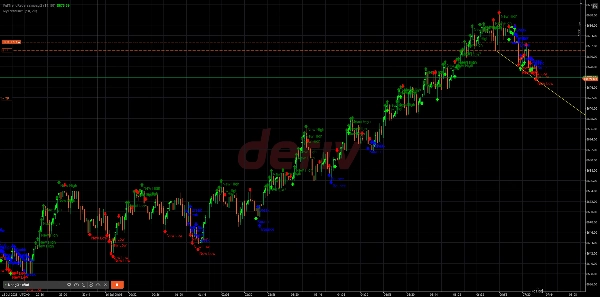
• Fiyatın trend çizgisini kırdığı kırılma noktalarını tespit eder ve işaretler, olası trend dönüş fırsatlarını gösterir.🔹 Kullanım:
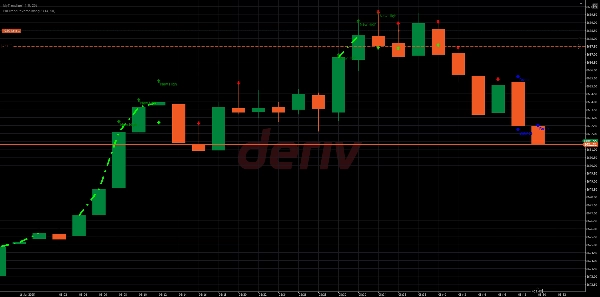
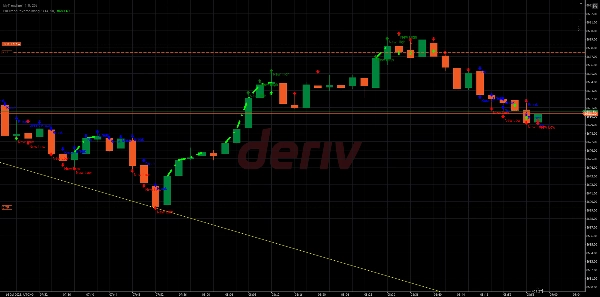
• Mevcut trend yönünde işlem yapmak için sektirme sinyallerini kullanın.
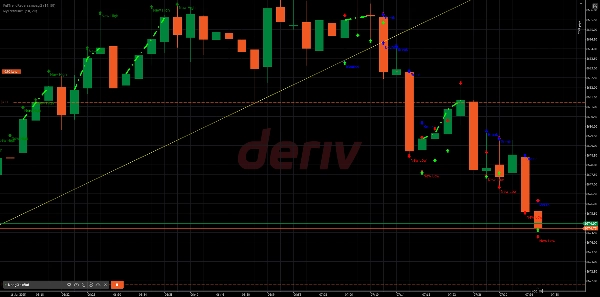
• Olası dönüşler veya geri çekilmeler için hazırlık yapmak amacıyla kırılma sinyallerini kullanın.✨ Dinamik destek ve direnç seviyeleri ile net kırmızı/yeşil ok sinyalleri sağlayan FullTrendReversalmoagi2 göstergesi ile özellikle iyi çalışır ve giriş-çıkışların doğrulanmasına yardımcı olur.
Bu sinerji, tüccarların yanlış kırılmaları filtrelemesine ve mevcut trend bağlamında daha yüksek güvenle işlem yapmasına olanak tanır.


