
Pivot Points Clasic,FIBO,etc
Indikator
830 muat turun
Versi 1.0, Jul 2025
Windows, Mac
Penerangan
Pivot Points Customizable — Penunjuk Titik Pivot Serba Boleh Terunggul untuk cTrader
Buka kuasa analisis tindakan harga profesional dengan satu alat serbaguna!
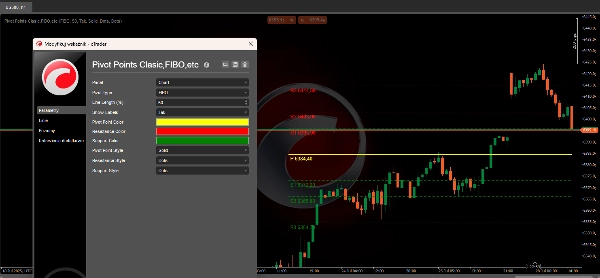
Pivot Points Customizable adalah penunjuk canggih dan sangat fleksibel untuk cTrader yang meletakkan semua kaedah pengiraan pivot utama di hujung jari anda — memberikan anda tahap sokongan/rintangan yang jelas, gaya tersuai, dan pelabelan carta pintar.
Ciri-ciri Utama:
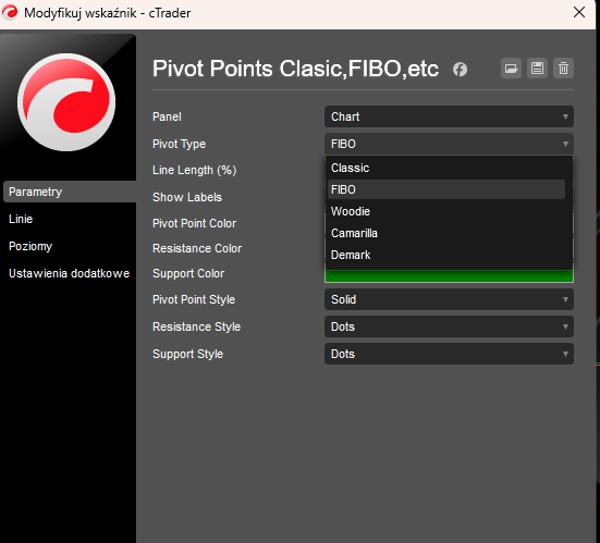
- 5 Kaedah Pivot dalam Satu:
Beralih serta-merta antara formula Classic, Fibonacci, Woodie, Camarilla, dan Demark. Sesuai untuk semua gaya dagangan: scalping, dagangan harian, dan dagangan ayunan. - Penyesuaian Lengkap:
-
- Pilih kaedah pengiraan pivot anda.
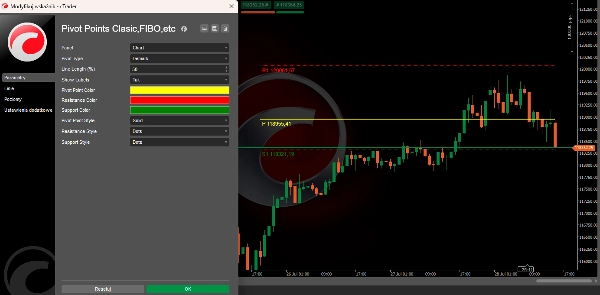
- Tetapkan warna dan gaya garis tersuai untuk tahap pivot, rintangan, dan sokongan.
- Laraskan panjang garis yang kelihatan sebagai peratusan carta anda untuk visual yang kemas dan tidak berserabut.
- Hidupkan/matikan label pintar yang menunjukkan tahap harga masa nyata untuk setiap pivot.
- Lapisan Carta Profesional:
Melukis pivot dan tahap S/R terus pada carta harga anda, dikemas kini secara automatik apabila bar baru muncul.
Tahap yang disokong untuk setiap kaedah: -
- Classic, Fibo, Woodie: Sehingga 3–4 rintangan (R1–R4) dan sokongan (S1–S4)
- Camarilla: Sehingga 4 rintangan dan sokongan
- Demark: Tahap unik tersuai (R1, S1, dan Pivot sahaja)
- Pantas & Ringan:
Dioptimumkan untuk prestasi masa nyata — tiada kelewatan, tiada perpustakaan luaran, 100% kod asli cTrader. - Sesuai untuk Semua Pasaran:
Berfungsi dengan sempurna dengan Forex, indeks, komoditi, kripto, dan banyak lagi!
Mengapa memilih Pivot Points Customizable?
- Pelbagai strategi, satu alat: Tukar pivot dengan satu klik — uji yang sesuai dengan pasaran anda!
- Kenal pasti tahap utama dengan cepat:
Akses segera ke zon di mana pembalikan harga atau pecahan paling mungkin berlaku. - Kejelasan carta terbaik:
Garis menyesuaikan secara automatik dengan tetingkap carta anda — tiada lagi penunjuk yang berserabut atau bertindih. - Tingkatkan keyakinan dagangan anda:
Ketahui di mana institusi dan profesional memantau harga setiap sesi.
Buat keputusan dagangan yang lebih baik hari ini. Cuba Pivot Points Customizable — dan lihat perbezaannya dalam analisis teknikal anda!
Ringkasan
Ringkasan AI
Pivot Points Customizable is a versatile indicator designed for the cTrader platform that integrates five major pivot point calculation methods: Classic, Fibonacci, Woodie, Camarilla, and Demark. It provides traders with clear support and resistance levels directly overlaid on price charts, updating automatically as new bars form. Users can fully customize the indicator by selecting pivot calculation methods, adjusting colors and line styles for pivot, resistance, and support levels, and setting line lengths relative to the chart window to maintain visual clarity. Smart labels displaying real-time price levels for each pivot can be toggled on or off. The indicator supports multiple resistance and support levels depending on the method chosen—up to four for Classic, Fibonacci, Woodie, and Camarilla, and unique levels for Demark. Optimized for real-time performance with native cTrader code, it operates without lag or external dependencies. This tool is suitable for various trading styles including scalping, day trading, and swing trading, and is compatible with multiple markets such as Forex, indices, commodities, and cryptocurrencies. It aims to assist traders in identifying key price levels where reversals or breakouts are likely, enhancing technical analysis and decision-making.
Profil indikator
Ulasan pelanggan
0.0
Ulasan: 0
Ulasan pelanggan
Belum ada ulasan untuk produk ini. Anda sudah mencuba produk tersebut? Jadilah yang pertama untuk berkongsi pendapat anda!
Perbincangan
Soalan Lazim
Produk yang tersedia melalui cTrader Store, termasuk bot dagangan, indikator dan plugin, disediakan oleh pembangun pihak ketiga dan diberikan akses untuk tujuan maklumat dan teknikal sahaja. cTrader Store bukan broker dan tidak memberikan nasihat pelaburan, syor peribadi atau sebarang jaminan prestasi masa hadapan.


![Logo "[Stellar Strategies] Market Session Ultimate"](https://cdn.ctrader.com/image/webp/61ffd537-0125-4246-9e72-42eca1791d64_28232)
Harga
Sejak 26/06/2025
60.93M
Volum yang didagangkan
968.89K
Pip dimenangi
830
Pemasangan percuma