Penerangan
Penunjuk MagicLiquidity adalah alat canggih yang mengenal pasti zon kecairan, blok pesanan, dan tahap hentian kerugian di pasaran, membantu pedagang mengenal pasti kawasan sokongan/rintangan utama dan titik pembalikan yang berpotensi.
Konsep Utama
Blok Pesanan: Kawasan di mana peserta pasaran besar mungkin telah meletakkan pesanan yang signifikan
Kolam Kecairan: Tahap di mana terdapat tumpuan hentian atau pesanan tertunda
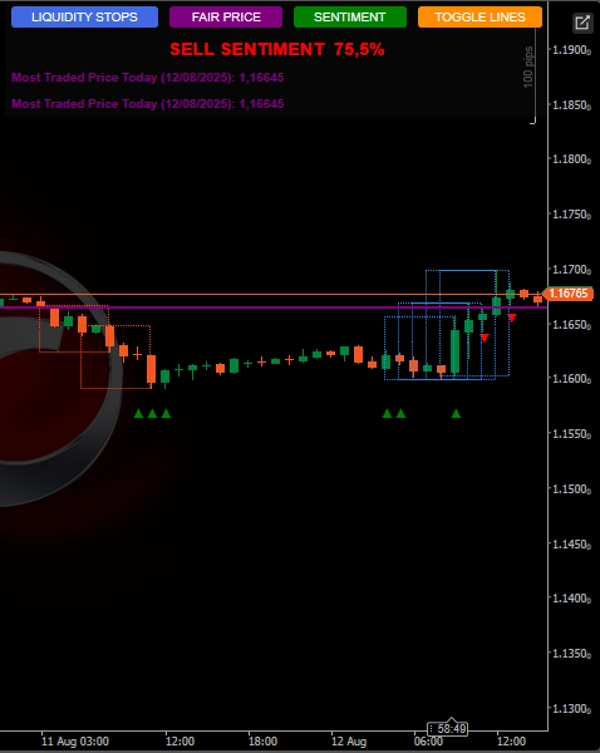
Harga Perdagangan Terbanyak Harga Adil: Tahap harga dengan jumlah dagangan tertinggi pada hari tersebut
Bagaimana Penunjuk Berfungsi
Pengenalpastian Blok Pesanan
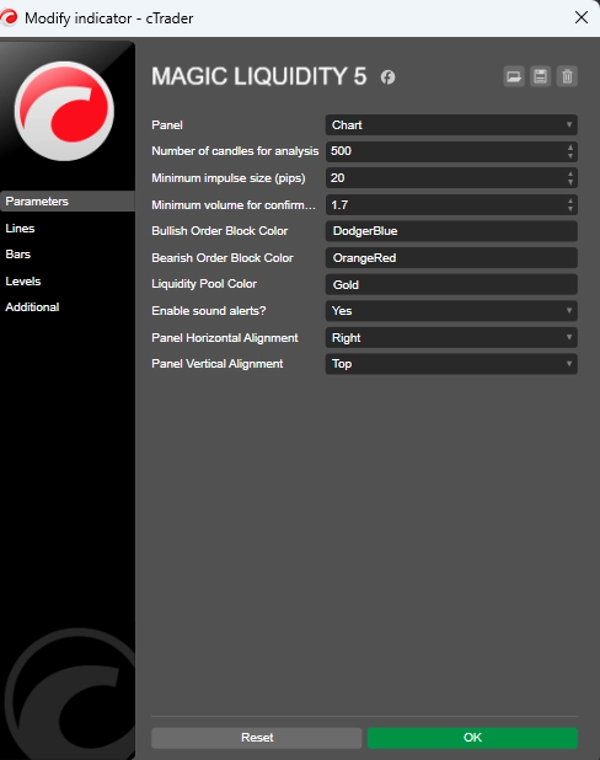
Mengesan pergerakan impulsif dengan saiz minimum yang boleh dikonfigurasikan dalam pips
Mengenal pasti pengukuhan selepas pergerakan ini
Mengklasifikasikan sebagai blok bullish atau bearish berdasarkan arah impuls
Pengesanan Kolam Kecairan
Mengenal pasti paras tertinggi dan terendah dalam tempoh yang dianalisis
Mengikuti tahap di atas dan di bawah harga semasa
Mengira berapa banyak kolam kecairan telah dicairkan dicapai
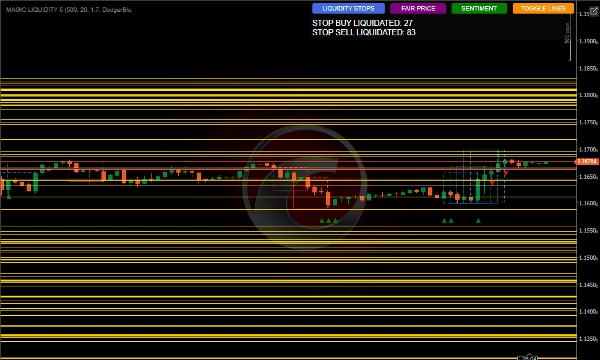
Panel Maklumat
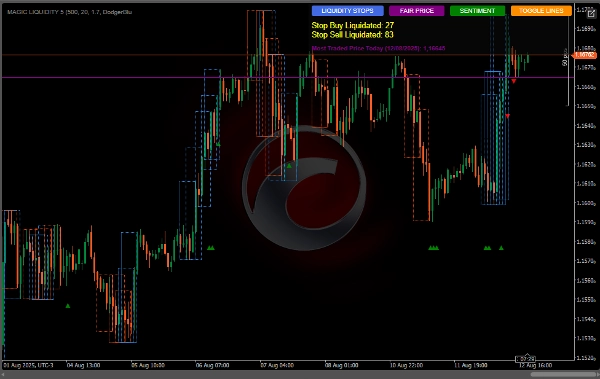
Menunjukkan kiraan hentian beli/jual yang dicairkan
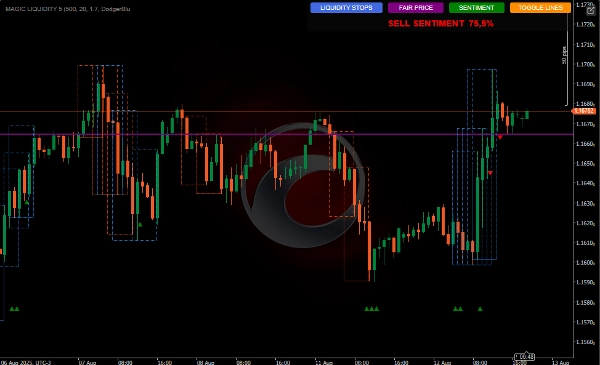
Memaparkan sentimen pasaran bullish/bearish
Menunjukkan harga dagangan terbanyak hari
Membolehkan anda menghidupkan/mematikan paparan garis
Pengesahan volum
Corak pembalikan
Hentian kerugian di atas blok
Kecairan Perdagangan
Pencairan Hentian Beli: Apabila harga mencapai kolam kecairan di atas:
Mungkin menunjukkan keletihan pembelian - bersedia untuk menjual
Masuk selepas pengesahan pembalikan
Pencairan Hentian Jual: Apabila harga mencapai kolam kecairan di bawah:
Mungkin menunjukkan keletihan penjualan - bersedia untuk membeli
Masuk selepas pengesahan pembalikan
Menggunakan Sentimen
Apabila terdapat lebih banyak kolam kecairan yang dicairkan di atas: kecenderungan sisi Jual
Apabila terdapat lebih banyak kolam kecairan yang dicairkan di bawah: kecenderungan beli
Gunakan sebagai penapis untuk menyelaraskan perdagangan dengan sentimen yang sedang berlaku
Harga Perdagangan Terbanyak (Harga Adil)
Boleh berfungsi sebagai tahap pulang modal
Perdagangan di atas: kecenderungan bullish
Perdagangan di bawah: kecenderungan bearish
Boleh digunakan sebagai sasaran atau titik pembalikan
.


