Penerangan
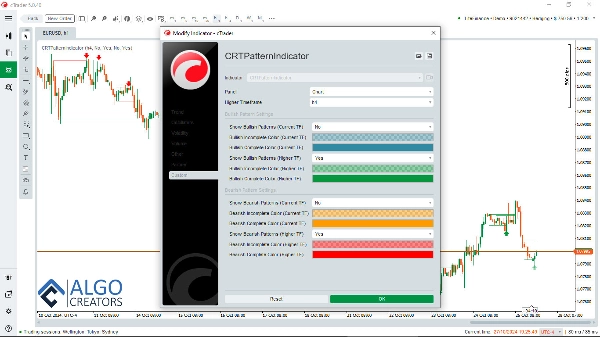
Penunjuk CRT (Candle Range Theory) adalah alat analisis yang kuat yang direka khusus untuk pedagang yang mengikuti metodologi ICT (Inner Circle Trader). Penunjuk ini mengenal pasti corak candlestick penting yang berkaitan dengan CRT, yang penting untuk memahami pergerakan pasaran dan tindakan harga.
Penunjuk cTrader CRT dilengkapi dengan keupayaan pelbagai jangka masa, membolehkan pedagang melihat corak CRT jangka masa tinggi (HTF) semasa beroperasi pada jangka masa rendah (LTF). Fungsi ini penting untuk mendapatkan pandangan mengenai struktur pasaran keseluruhan dan memperbaiki keputusan perdagangan.
Pergerakan harga dan Kuasa 3 ICT (AMD):
Penunjuk CRT memudahkan analisis pergerakan harga dan pengenalan corak yang berkaitan dengan Kuasa 3 ICT (Anatomi Dinamik Pasaran - AMD).
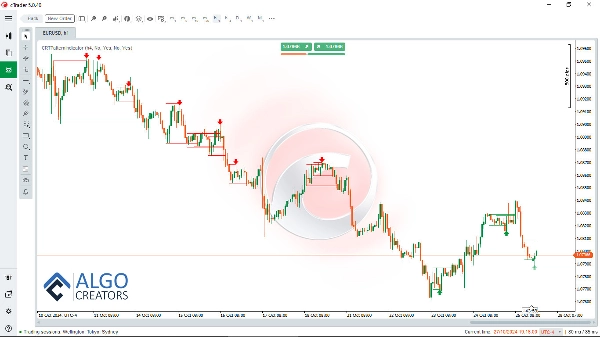
LTF CRT dalam HTF CRT:
Dengan mengenal pasti titik sokongan dan rintangan utama dengan mudah, pedagang dapat menganalisis tindakan harga dengan lebih jelas. Selain itu, penunjuk CRT menonjolkan corak HTF dan LTF, membantu pedagang menavigasi dinamik pelbagai kitaran pasaran.
gunakan penunjuk CRT dengan konsep perdagangan lain:
Menggabungkan CRT dengan konsep perdagangan lain seperti FVGs, blok pesanan dan turtle soup meningkatkan kebarangkalian mengenal pasti perdagangan yang berjaya.
Selain itu, penunjuk CRT berfungsi sebagai pelengkap yang sangat berharga kepada Penolong Wang Pintar , sebuah alat canggih yang direka untuk membantu pedagang wang pintar dengan pandangan pasaran kritikal dan membuat keputusan. Gabungan kedua-dua penunjuk ini menghasilkan kotak alat perdagangan holistik yang meningkatkan keupayaan pedagang untuk menganalisis dan bertindak.
Muat turun Penolong Wang Pintar: https://ctrader.com/algos/show/3956/
Untuk meningkatkan lagi strategi perdagangan, penunjuk Pencari FVG boleh digunakan bersama penunjuk CRT. Alat ini mengesan Jurang Nilai Adil (FVGs) pada carta, yang apabila digunakan bersama isyarat CRT, meningkatkan kemungkinan membuat perdagangan yang berjaya.
Muat turun penunjuk pencari FVG: https://ctrader.com/algos/show/3877/
Dengan menggabungkan penunjuk-penunjuk ini, pedagang dapat membina sistem yang kukuh yang memanfaatkan setup kebarangkalian tinggi, membolehkan mereka menavigasi pasaran dengan berkesan dan mengoptimumkan hasil perdagangan mereka.
Muat turun penunjuk CRT dengan Amaran:: www[dot]AlgoCreators[dot]net
Dengan CRT, Penolong Wang Pintar, dan Pencari FVG dalam alat anda, anda boleh memaksimumkan pemahaman anda tentang tren pasaran dan meningkatkan prestasi perdagangan keseluruhan anda, menjadikannya sumber penting bagi pedagang yang ingin cemerlang dalam gaya perdagangan ICT.
Ringkasan
It simplifies the recognition of price movements related to ICT’s Power of 3 (Anatomy of Market Dynamics - AMD) and highlights critical support and resistance levels. By displaying both higher and lower timeframe patterns, it helps traders interpret market cycles more clearly.
The CRT indicator can be combined with other trading concepts such as Fair Value Gaps (FVGs), order blocks, and turtle soup patterns to enhance trade identification. It also complements the Smart Money Assistant indicator, providing a comprehensive toolkit for smart money trading analysis.
Additionally, pairing the CRT indicator with the FVG Finder, which detects Fair Value Gaps, can improve the probability of successful trades. Together, these tools support the development of robust trading strategies aligned with the ICT style.
Ulasan pelanggan
5 | 83 % | |
4 | 17 % | |
3 | 0 % | |
2 | 0 % | |
1 | 0 % |