


Penerangan
MARCs Market Overview Lite XAUUSD adalah penunjuk tinjauan pasaran skop terhad percuma untuk cTrader.
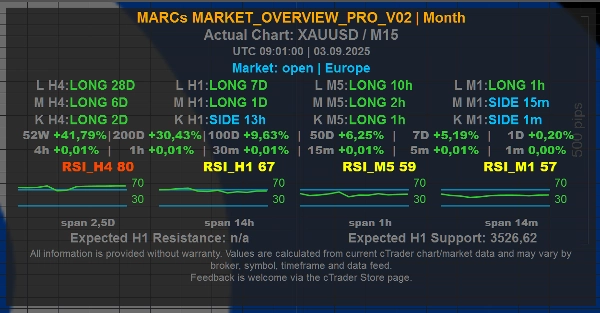
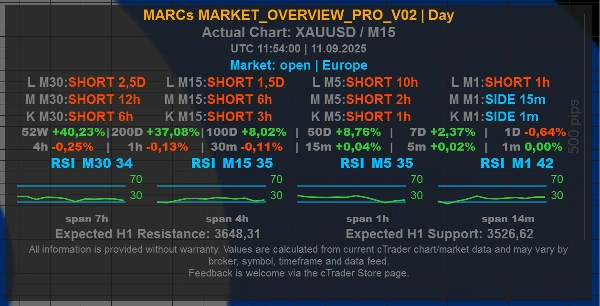
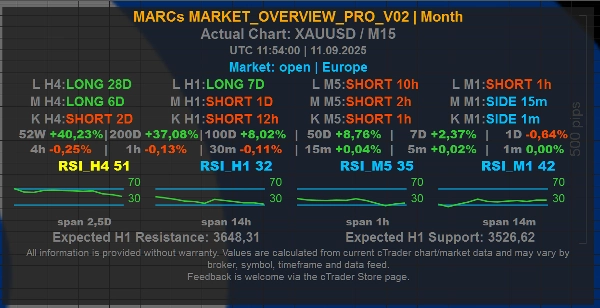
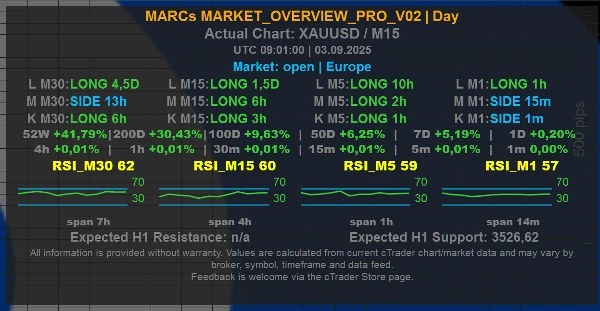
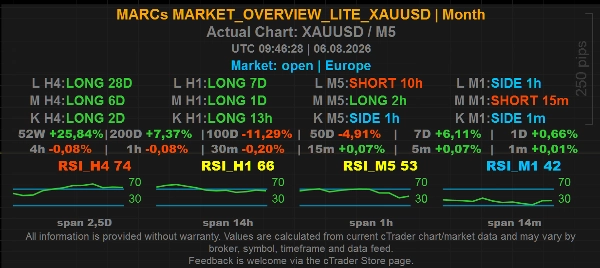
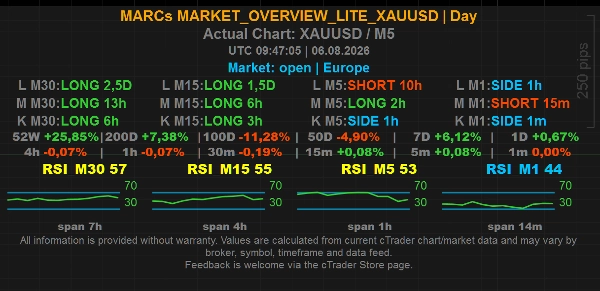
Ia memaparkan papan pemuka padat di carta untuk carta XAUUSD / Emas dengan konteks trend pelbagai jangka masa, bacaan RSI, maklumat pasaran/sesi, nilai tahap carta pilihan dan set kawalan paparan yang dipermudahkan.
Edisi Lite ini direka sebagai alat tinjauan fokus XAUUSD. Ia mengekalkan aliran kerja panel teras MARCs Market Overview sambil menggunakan tetapan dalaman tetap dan pilihan pratetap terhad.
Ciri-ciri utama:
- Edisi Lite percuma untuk carta XAUUSD
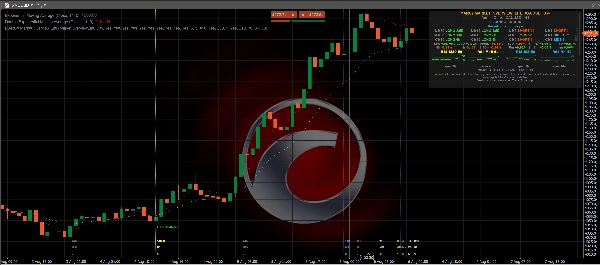
- Panel tinjauan pasaran padat di carta
- Baris trend pelbagai jangka masa untuk konteks pasaran jangka pendek, sederhana dan panjang
- Nilai RSI dan sejarah mini RSI merentasi jangka masa dalaman tetap
- Garis pasaran/sesi dengan masa UTC
- Pratetap horizon masa Hari dan Bulan
- Garis pasaran pilihan
- Nilai tahap carta H1 pilihan dipaparkan terus dalam panel
- Garis tahap H1 pilihan yang dipermudahkan pada carta
- Label garis pilihan, penanda asal tahap dan penanda imbasan semula
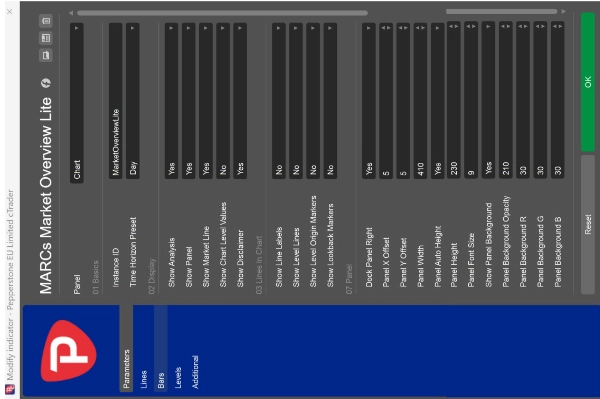
- Kedudukan panel, lebar, tinggi, saiz fon dan penampilan latar belakang yang boleh disesuaikan sepenuhnya
Had edisi Lite:
- Berfungsi hanya pada carta XAUUSD
- Pratetap Horizon Masa terhad kepada Hari dan Bulan
- Baris trend menggunakan jangka masa dalaman dan tetapan lilin tetap
- Paparan RSI menggunakan tetapan dalaman tetap
- Paparan masa menggunakan tetapan dalaman tetap
- Nilai tahap carta terhad kepada H1
- Garis tahap carta tersedia sebagai pilihan hidup/mati yang dipermudahkan dan menggunakan tahap H1 tetap
- Beberapa pilihan penyesuaian lanjutan dari versi Pro tidak termasuk
Jika penunjuk dipasang pada simbol lain, panel akan menunjukkan notis jelas hanya untuk XAUUSD dan bukannya memaparkan nilai tinjauan.
Garis Tahap dan Nilai Tahap Carta:
Tetapan Tunjukkan Garis Tahap pilihan boleh memaparkan tahap rujukan carta H1 yang dikira. Dalam edisi Lite, ini dipermudahkan kepada pilihan hidup/mati. Apabila diaktifkan, penunjuk menunjukkan rintangan terdekat yang dikira di atas harga semasa dan sokongan terdekat yang dikira di bawah harga semasa.
Tetapan Tunjukkan Nilai Tahap Carta pilihan boleh menunjukkan nilai rujukan rintangan/sokongan H1 terdekat yang sama terus dalam panel tanpa melukis garis pada carta. Garis panel dilabel, contohnya, "Chart Levels H1 | R ... | S ..." untuk menjelaskan bahawa nilai tersebut merujuk kepada rujukan tahap carta.
Bagaimana Garis Tahap dikira:
Tahap-tahap tersebut diperoleh daripada puncak ayunan dan dasar ayunan lalu dalam jangka masa dalaman yang dipilih. Titik ayunan berdekatan digabungkan ke dalam kelompok tahap, dan hanya kawasan dengan sentuhan berulang yang mencukupi dipaparkan. Ini menjadikan garis-garis tersebut penanda konteks pasaran visual berdasarkan sejarah carta yang tersedia.
Apa yang Garis Tahap tidak maksudkan:
Garis Tahap bukan isyarat beli, isyarat jual, cadangan stop-loss, cadangan ambil untung atau nasihat pelaburan. Ia tidak meramalkan bahawa harga akan berbalik, melepasi atau bertindak balas pada tahap tertentu.
Mengenai versi Pro:
MARCs Market Overview Pro menawarkan penggunaan simbol yang lebih luas, lebih banyak pratetap horizon masa dan pilihan penyesuaian yang lebih terperinci. Edisi Lite XAUUSD adalah versi percuma dan fokus untuk pedagang yang mahukan panel tinjauan pasaran Emas/XAUUSD yang lebih mudah.
Penting:
MARCs Market Overview Lite XAUUSD adalah alat tinjauan pasaran hanya untuk analisis. Ia tidak membuat dagangan, menguruskan posisi, memberikan nasihat pelaburan atau menjamin hasil dagangan.
Semua bacaan bergantung pada data carta cTrader yang tersedia, suapan simbol broker, jangka masa dan sejarah pasaran. Nilai mungkin berbeza antara broker, simbol dan suapan data.
Perdagangan melibatkan risiko. Prestasi lalu tidak menjamin hasil masa depan.
NOTA KETERBUKAAN
Penunjuk ini dibangunkan dengan bantuan alat berasaskan AI.
Ringkasan
Level lines are calculated from past swing highs and lows on the H1 timeframe, highlighting key resistance and support clusters based on repeated price touches. These lines serve as visual market context markers but do not constitute trading signals or advice.
The panel’s position, size, font, and background appearance are fully adjustable. The Lite edition uses fixed internal settings and limited presets, restricting its use to XAUUSD charts only. It does not place trades or provide investment recommendations. This tool relies on available chart data and broker feeds, which may vary.
This edition offers a streamlined overview for Gold traders, with broader symbol support and customization available in the Pro version.
Perbincangan
Ulasan pelanggan
5 | 0 % | |
4 | 100 % | |
3 | 0 % | |
2 | 0 % | |
1 | 0 % |
Soalan Lazim






![Logo "[Hamster-Coder] Moving Average MTF"](https://cdn.ctrader.com/image/webp/b11b98b1-194d-4b8e-b00e-d611826ad159_31226)









Harga