Penerangan
Penunjuk Follow Line adalah penunjuk cTrader yang kuat untuk analisis teknikal, membantu pedagang mengenal pasti titik masuk dan keluar yang optimum dalam pasaran kewangan. Dengan menggabungkan Bollinger Bands dan penunjuk ATR, ia menapis tren dan memberikan isyarat beli dan jual yang boleh dipercayai.
Dengan penunjuk ini, anda boleh dengan mudah mengenal pasti tren pasaran menaik atau menurun dan mengikuti isyarat yang mempunyai keyakinan tinggi.
Pedagang boleh menggabungkan Penunjuk Follow Line dengan alat canggih seperti penunjuk Smart Money Assistant cTrader dan pengayun seperti MACD untuk meningkatkan analisis mereka dan mengesahkan kemasukan perdagangan.
Tetapan yang boleh disesuaikan dan amaran masa nyata menjadikannya tambahan yang berharga kepada mana-mana strategi perdagangan, membolehkan pengguna melaksanakan perdagangan yang berjaya dengan keyakinan dan ketepatan.
Ciri-ciri Utama:
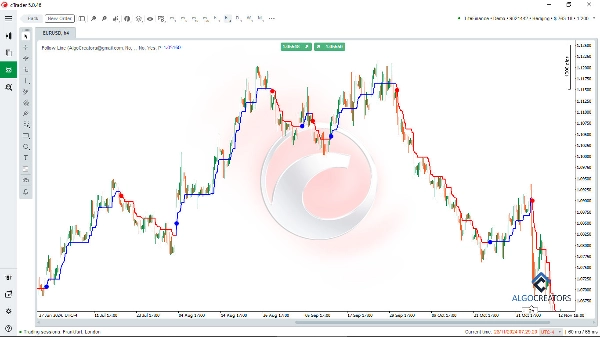
- Pengesanan Tren: Gunakan Follow Line untuk mengenal pasti tren pasaran menaik atau menurun.
- Isyarat Beli/Jual: Paparkan isyarat beli dan jual yang tepat berdasarkan pecahan Bollinger Bands.
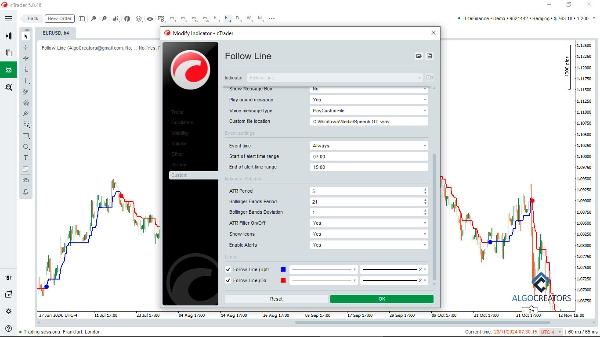
- Penapis ATR: Pilihan untuk mengaktifkan atau mematikan penapis ATR bagi meningkatkan ketepatan isyarat.
- Tetapan Boleh Disesuaikan: Laraskan tempoh Bollinger Bands, sisihan piawai, dan tempoh ATR.
- Perwakilan Visual: Paparkan isyarat pada carta menggunakan ikon intuitif (anak panah atau garis).
- Amaran: Terima amaran segera setiap kali isyarat beli atau jual muncul.
Penunjuk ini sangat boleh disesuaikan, membolehkan pedagang melaraskan tempoh Bollinger Bands, sisihan piawai, dan tetapan ATR mengikut strategi mereka. Petunjuk visual dan amaran segera menjadikannya mesra pengguna dan berkesan untuk scalping dan swing trading. Dengan ciri seperti pengesanan tren, pengurusan risiko, dan tetapan boleh disesuaikan, Penunjuk Follow Line adalah ideal untuk pedagang forex, kriptowang, dan saham yang ingin meningkatkan analisis teknikal dan prestasi perdagangan mereka.
Sesuai untuk mengenal pasti peluang pasaran yang tepat!
Ringkasan
Users can customize settings such as Bollinger Bands period, standard deviation, and ATR period to align with their trading strategies. The indicator visually represents signals on the chart using intuitive icons like arrows or lines and provides real-time alerts when signals occur. It supports various trading styles, including scalping and swing trading, and is suitable for forex, cryptocurrency, and stock markets.
The Follow Line indicator can be combined with other tools like the cTrader Smart Money Assistant and MACD oscillators to confirm trade entries and enhance analysis. Its customizable features and alert system assist traders in identifying precise market opportunities and managing risk effectively.
Ulasan pelanggan
5 | 60 % | |
4 | 20 % | |
3 | 20 % | |
2 | 0 % | |
1 | 0 % |