
COSA FA
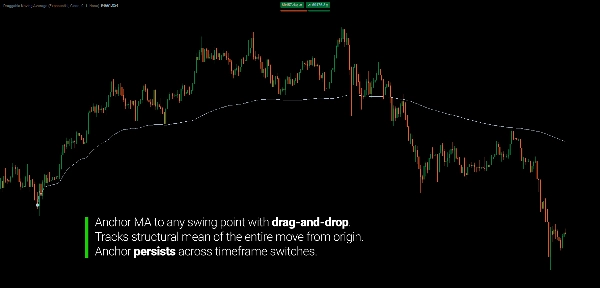
Draggable Moving Average ancora una media mobile a qualsiasi punto nella storia dei prezzi — non dall'inizio della barra, non da un periodo fisso, ma esattamente da dove la posizioni.
Le medie mobili standard partono dall'inizio dei dati del grafico e convergono nel tempo. Il loro periodo è fisso. Il loro riferimento iniziale è arbitrario. Quando vuoi misurare come il prezzo si è evoluto da un evento strutturale specifico — un inizio correttivo, un inizio di impulso, un punto chiave di oscillazione — non c'è modo di ancorare la MA a quel momento.
Questo indicatore risolve questo problema.
Posiziona l'icona ancora su qualsiasi barra. La MA parte da quella barra e si estende in avanti. Trascina l'icona su una barra diversa — la MA si ricalcola istantaneamente dalla nuova posizione. Cambia timeframe — l'ancora rimane, la MA si ricalcola automaticamente sul nuovo grafico.
Il risultato è una media mobile che riflette sempre come il prezzo si è evoluto da un punto strutturale specifico che definisci.
IL VANTAGGIO PRINCIPALE
Approccio Standard:
- Identificare l'inizio di un movimento correttivo o impulsivo
- Applicare una MA a periodo fisso — parte dall'inizio del grafico, non dalla tua struttura
- Regolare manualmente il periodo per approssimare la lunghezza della struttura
- Cambiare timeframe — il periodo perde significato con diversi conteggi di barre
- Ripetere ogni volta che la struttura cambia
Approccio Draggable:
- Posizionare l'ancora all'inizio della struttura
- La MA calcola in avanti da quella barra esatta
- Cambiare timeframe — l'ancora rimane, la MA si ricalcola automaticamente
- Trascinare per regolare — tutto si aggiorna istantaneamente
La differenza è strutturale. Invece di approssimare un punto di riferimento tramite aggiustamenti del periodo, lo definisci direttamente. Il punto strutturale è l'input — non il periodo.
ANCORATO ALLA STRUTTURA: RILEVAZIONE DELLA REVERSIONE ALLA MEDIA E DEL RIBALTAMENTO
Quando una media mobile parte da un punto di oscillazione strutturale — l'origine di un trend, l'inizio di un impulso o l'inizio di una correzione — smette di essere una linea di smussamento arbitraria e inizia a comportarsi come una media strutturale.
Il prezzo si organizza attorno a quella media in modi prevedibili:
- Durante il movimento, il prezzo oscilla attorno alla MA ancorata — si allontana durante esplosioni di momentum, torna alla MA durante la consolidazione. La MA riflette il prezzo medio dell'intera struttura dalla sua origine, non solo delle barre recenti.
- Alla fine, il prezzo inizia a attraversare la MA ancorata invece di rimbalzare da essa. Una chiusura sotto una MA ancorata inclinata verso l'alto — che ha seguito un impulso dalla sua origine — ha un significato strutturale. La media dell'intero movimento viene violata.
- Dopo il ribaltamento, la MA ancorata diventa resistenza. I retest della MA dal basso segnano aree logiche dove la media strutturale precedente agisce come offerta.
Questo comportamento è coerente perché la MA misura la cosa giusta: il prezzo medio di un movimento strutturale specifico dal suo punto di partenza reale, non da un periodo arbitrario passato.
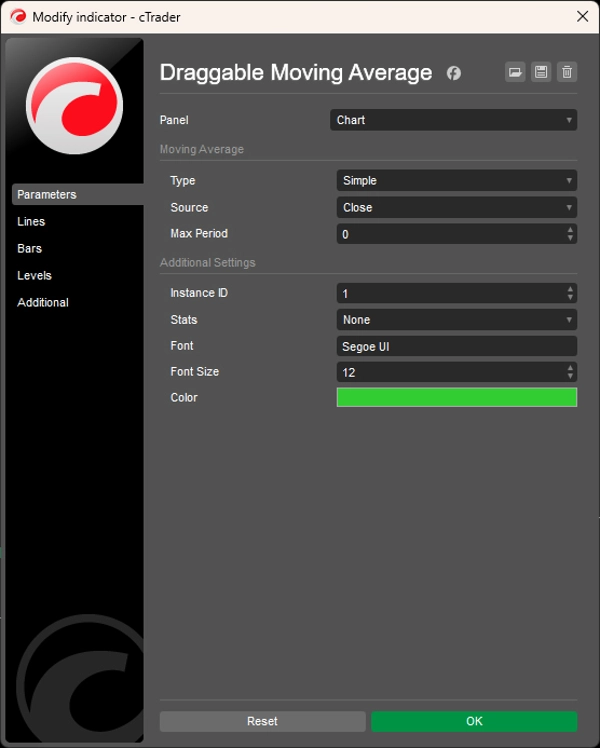
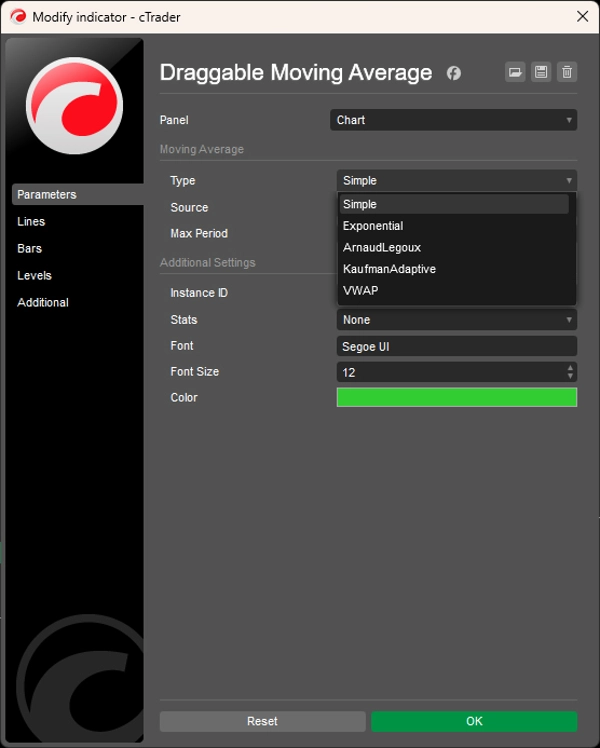
TIPI DI MA SUPPORTATI
Cinque metodi di calcolo, selezionabili per ogni istanza:
- Semplice (SMA) — media aritmetica dall'ancora in avanti; cresce con ogni barra fino al raggiungimento del Periodo Massimo
- Esponenziale (EMA) — ponderata esponenzialmente; più reattiva all'azione recente del prezzo
- Arnaud Legoux (ALMA) — ponderata gaussianamente; riduce il ritardo senza amplificare il rumore
- Kaufman Adaptive (KAMA) — regola dinamicamente la smussatura basata sul rapporto di efficienza del mercato; si restringe durante condizioni di trend, si allarga durante la consolidazione
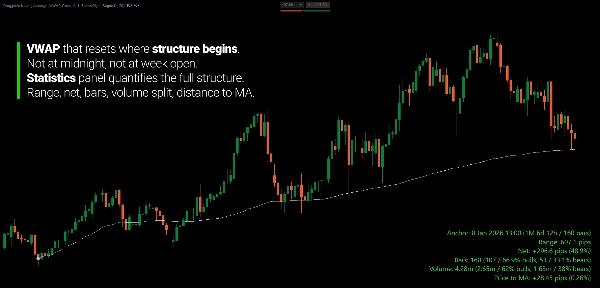
- VWAP — media ponderata per volume dall'ancora; riflette dove è stato scambiato il maggior volume dal punto strutturale
Tutti i tipi rispettano il Periodo Massimo — limitano la finestra di lookback mantenendo l'ancora come riferimento di origine.
PANNELLO STATISTICO
Pannello opzionale sovrapposto, selezionabile in quattro posizioni agli angoli, mostra metriche in tempo reale dall'ancora alla barra corrente:
- Range in pips (massimo massimo al minimo minimo)
- Variazione netta in pips e percentuale
- Totale barre con conteggio e percentuali rialziste/ribassiste
- Volume totale con suddivisione e percentuali rialziste/ribassiste
- Distanza del prezzo corrente dalla MA in pips e percentuale
- Durata e conteggio barre dalla barra ancora alla barra corrente
Utile per quantificare la struttura esatta a cui hai ancorato — non solo la linea MA, ma il profilo statistico completo del movimento di prezzo dall'origine ad ora.
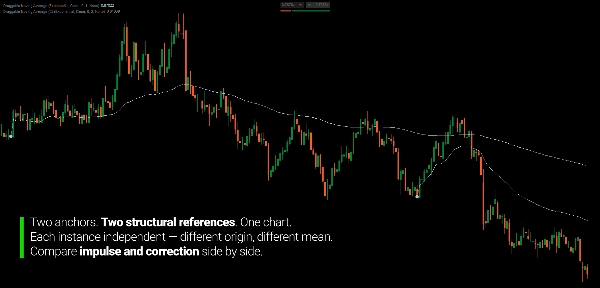
SUPPORTO MULTI-ISTANZA
Ogni istanza ha un ID univoco. Più istanze possono funzionare simultaneamente — una ancorata all'inizio di una correzione, un'altra all'impulso precedente — senza conflitti di icone o etichette.
CARATTERISTICHE PRINCIPALI
- Icona ancora trascinabile — posiziona su qualsiasi barra, trascina per regolare, la MA si aggiorna istantaneamente
- Cinque tipi di MA (SMA, EMA, ALMA, KAMA, VWAP)
- Otto fonti di prezzo (Open, High, Low, Close, Average, Median, Typical, Weighted)
- Limite Periodo Massimo con finestra mobile dall'origine ancora
- Pannello statistico opzionale con quattro posizioni agli angoli
- Supporto multi-istanza con ID univoci
- Ancora persistente attraverso i cambi di timeframe
A CHI È RIVOLTO
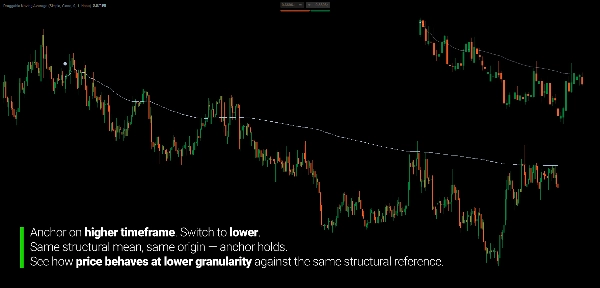
Questo indicatore è per i trader che analizzano la struttura di mercato attraverso i timeframe — in particolare per chi vuole misurare il comportamento del prezzo da un punto di riferimento strutturale definito piuttosto che da un periodo arbitrario di lookback.
Se analizzi gambe correttive e impulsive su timeframe più alti e hai bisogno di valutare quella stessa struttura a granularità di timeframe più bassi, l'ancora trascinabile ti permette di segnare il punto di partenza strutturale una volta e portarlo attraverso le viste dei timeframe. Ancora sul grafico Daily, passa a M15 — il riferimento rimane.
Si adatta a trader swing e di posizione che pensano in termini di movimenti strutturali piuttosto che periodi fissi, analisti multi-timeframe che necessitano di punti di riferimento coerenti tra i grafici, e trader discrezionali che vogliono un'ancoraggio MA preciso e definito dall'utente senza dover indovinare il periodo.
Non è un sistema di segnali. È uno strumento di misurazione strutturale per trader che già pensano in termini di movimenti di prezzo e vogliono che la loro media mobile rifletta quei movimenti con precisione.
COSA LO RENDE DIVERSO
Le medie mobili standard sono basate sul periodo. Il loro riferimento è implicito — n barre indietro dalla barra corrente. Quando un movimento strutturale termina e ne inizia uno nuovo, il periodo diventa irrilevante. Non puoi puntare una MA standard a un evento specifico.
Questo indicatore rende esplicito il riferimento. Ti ancora a un evento strutturale. La MA misura da lì. Il periodo non è l'input — lo è il punto strutturale.
Il risultato: una media mobile che riflette la tua analisi strutturale reale piuttosto che una sua approssimazione.
---
COMPRENDERE LA MEDIA MOBILE COME MEDIA STRUTTURALE
Le medie mobili sono spesso fraintese come livelli di supporto e resistenza. I trader aspettano che il prezzo "rispetti" la MA a 50 o rimbalzi dalla MA a 200 come se quei numeri avessero un significato intrinseco nel mercato. Non è così.
Una media mobile è una descrizione aritmetica di una distribuzione — il prezzo medio su una finestra definita. Ciò che determina se quella linea è significativa non è la formula. È se la finestra misurata ha rilevanza strutturale.
Per questo le MA basate sul periodo sono fondamentalmente limitate. Una MA a 50 periodi misura le ultime 50 barre — una finestra senza relazione con alcun evento strutturale. Non corrisponde a dove è iniziato un trend o dove è iniziata una correzione. È una finestra mobile di lunghezza arbitraria la cui posizione è determinata solo dalla recenza.
Quando ti ancora a un punto di oscillazione strutturale, la MA diventa la media di una distribuzione di prezzo specifica e coerente da quell'origine in avanti. Quando il prezzo devia molto al di sopra, i partecipanti entrati all'origine sono in estensione. Quando il prezzo torna, ciò riflette un riequilibrio della distribuzione. Quando il prezzo la attraversa nettamente, il partecipante medio dall'origine strutturale è in pareggio o in perdita — un cambiamento di regime statistico, non una linea che viene rotta.
La geometria non è la causa. È la descrizione statistica di una distribuzione strutturale i cui confini hai definito.
---
Il trading comporta rischi. Questo indicatore è uno strumento di analisi tecnica — applica sempre una corretta gestione del rischio.


