Descrizione
⚡ Kaufman Efficiency Ratio (KER) – Edizione Gratuita
Chiarezza del trend, quantificata.
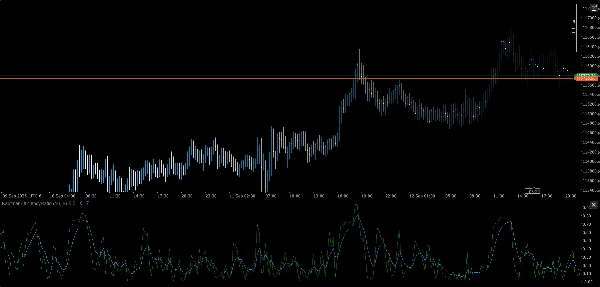
Il Kaufman Efficiency Ratio (KER) è uno strumento di precisione per misurare quanto efficacemente il prezzo si muove dal punto A al punto B—senza perdersi nel rumore. Che tu stia convalidando condizioni di breakout o filtrando movimenti laterali, KER ti offre un punteggio netto tra 0 e 1 che riflette l’intento direzionale rispetto alla volatilità.
🔍 Cosa Fa
- Calcola il Kaufman’s Efficiency Ratio:
- Fornisce un valore normalizzato da 0 (rumore puro) a 1 (trend perfetto)
- Evidenzia regimi di trend rispetto a quelli non trend con zero ambiguità
- Ideale per sovrapposizioni adattive, filtri di regime e gating di segnali
🛠️ Caratteristiche Principali
- Gestore di input modulare per sourcing multi-timeframe
- Compatibile cross-asset: FX, crypto, indici, azioni
- Logica leggera e in tempo reale senza ritardi di smoothing
- Plug-and-play con la tua architettura suite esistente
🎯 Casi d’Uso
- Validazione del Trend: Conferma il bias direzionale prima dell’esecuzione del segnale
- Filtraggio del Rumore: Sopprime le entrate durante azioni di prezzo inefficienti
- Rilevamento del Regime: Abbina a sovrapposizioni consapevoli della volatilità per transizioni più intelligenti
- Costruzione di Strategie: Usalo come metrica centrale in logiche di breakout, momentum o bias
💡 Bonus
KER è gratuito, veloce e spietatamente efficiente—proprio come il tuo codice. Niente fronzoli, niente filtri. Solo intento di mercato puro, distillato.
Riepilogo
Profilo indicatore
Recensioni dei clienti
0.0
Recensioni: 0
Recensioni dei clienti
Questo prodotto non ha ancora ricevuto recensioni. L'hai già provato? Fallo sapere agli altri per primo!
Discussioni
Domande frequenti
Signal
Breakout
I prodotti disponibili tramite cTrader Store, inclusi bot di trading, indicatori e plugin, sono forniti da sviluppatori terzi e resi disponibili esclusivamente a scopo informativo e di accesso tecnico. cTrader Store non è un broker e non fornisce consulenze in materia di investimento, raccomandazioni individualizzate o garanzie di risultati futuri.


![Logo di "[Hamster-Coder] Pivot Points MTF"](https://cdn.ctrader.com/image/webp/4c143e5a-309c-40e3-a578-f04d1e133ffa_31159)


Prezzo
26
Vendite
2.18K
Installazioni gratuite