
WAVETREND_withSourceCode
Indikator
Versi 1.0, Oct 2025
Windows, Mac
5.0
Ulasan: 2
Penerangan
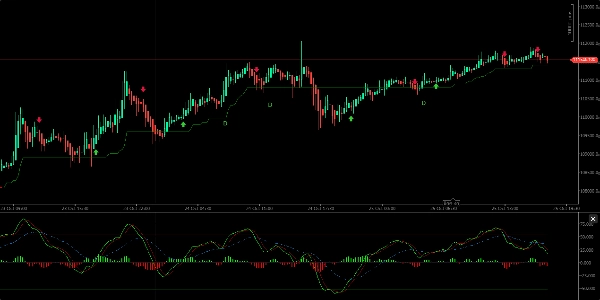
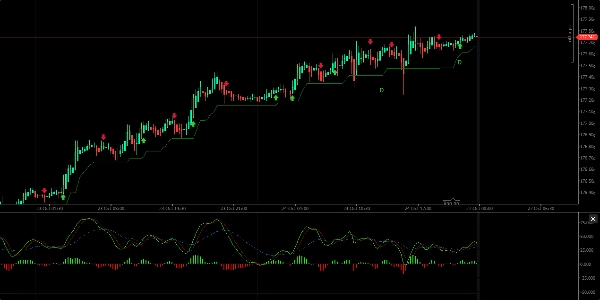
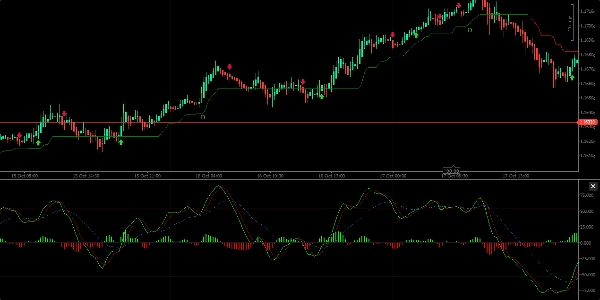
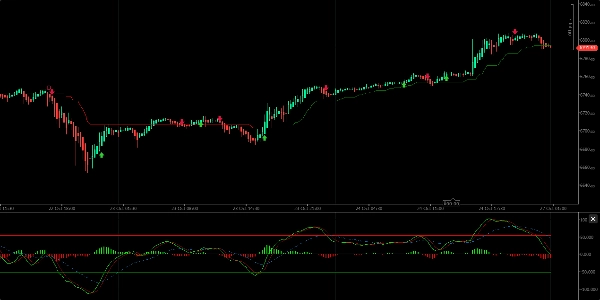
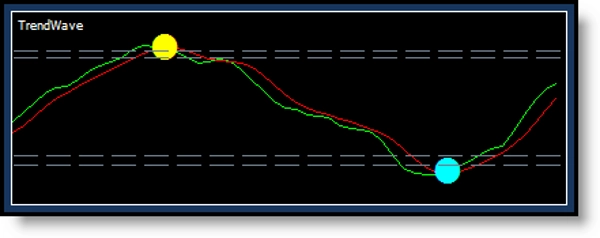
Ia menyediakan isyarat beli-jual, petunjuk arah aliran, dan mengenal pasti zon terlebih beli dan terlebih jual. Secara visual, ia terdiri daripada dua garis nilai dengan awan/histogram di tengah, yang bergerak di atas dan di bawah garis tengah, mewakili aliran menaik atau menurun.
Ciri-ciri Utama:
- Isyarat beli berlaku apabila garis hijau melintasi garis merah ke atas; isyarat jual apabila garis hijau melintasi ke bawah.
- Ia menunjukkan arah aliran dengan gelombang awan di atas atau di bawah garis tengah.
- Penunjuk memaparkan titik hijau (beli) dan merah (jual) pada titik persilangan, dengan perubahan warna lilin yang sepadan (kuning untuk beli, turquoise untuk jual).
- Sebaiknya digunakan pada selang masa 12 jam atau 1 hari untuk mengelakkan bunyi jangka pendek yang berlebihan.
- Penunjuk boleh mengenal pasti perbezaan antara harga dan momentum (perbezaan bullish dan bearish biasa), menandakan kemungkinan pembalikan harga.
- Adalah disyorkan untuk menggabungkan WaveTrend dengan penunjuk lain seperti WMA, CMF, RSI, dan MACD untuk keputusan perdagangan yang lebih boleh dipercayai.
Secara keseluruhan, WaveTrend adalah alat yang berfungsi berguna untuk mengenal pasti arah aliran dan isyarat perdagangan tetapi harus digunakan bersama alat analisis lain untuk pengesahan.
Ringkasan
Profil indikator
Ulasan pelanggan
5.0
Ulasan: 2
5 | 100 % | |
4 | 0 % | |
3 | 0 % | |
2 | 0 % | |
1 | 0 % |
Ulasan pelanggan
November 6, 2025
the main upside is the trade idea gets slowed down first. The setup still needs say no.
Perbincangan
Soalan Lazim
Signal
ZigZag
EURUSD
Supertrend
GBPUSD
RSI
XAUUSD
NAS100
ATR
MACD
Produk yang tersedia melalui cTrader Store, termasuk bot dagangan, indikator dan plugin, disediakan oleh pembangun pihak ketiga dan diberikan akses untuk tujuan maklumat dan teknikal sahaja. cTrader Store bukan broker dan tidak memberikan nasihat pelaburan, syor peribadi atau sebarang jaminan prestasi masa hadapan.


Harga
Sejak 16/03/2025
256
Pemasangan percuma