
FVG_Bruno
Indikator
Versi 1.0, Oct 2025
Windows, Mac
4.0
Ulasan: 2
Penerangan
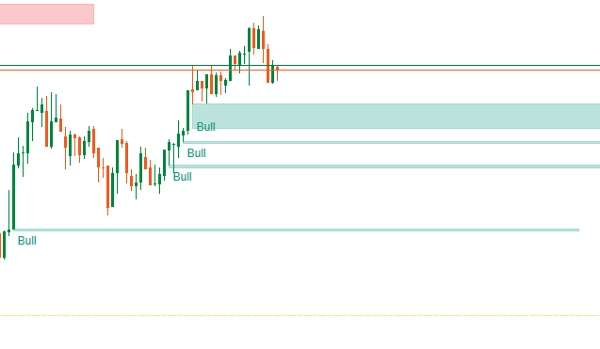
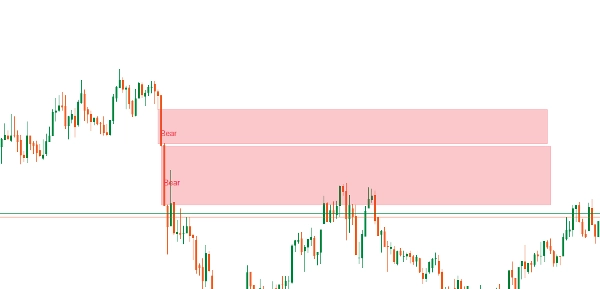
Satu FVG adalah ketidakseimbangan harga yang berlaku apabila pasaran bergerak dengan agresif ke satu arah, meninggalkan jurang antara lilin berturut-turut. Jurang ini mewakili kawasan di mana kecairan tidak dipertukarkan sepenuhnya, dan harga sering kembali ke kawasan itu kemudian untuk “mengisi” ketidakseimbangan tersebut.
Sebagai contoh:
- Dalam pergerakan menaik, jika Lilin 1 ditutup dan Lilin 3 dibuka jauh di atas paras tinggi Lilin 1, meninggalkan paras rendah Lilin 2 tidak diuji, jurang itu adalah FVG.
- Pedagang menjangkakan harga akan retrace ke dalam jurang ini sebelum meneruskan tren.
Ringkasan
Profil indikator
Ulasan pelanggan
4.0
Ulasan: 2
5 | 0 % | |
4 | 100 % | |
3 | 0 % | |
2 | 0 % | |
1 | 0 % |
Perbincangan
Soalan Lazim
BTCUSD
Forex
Signal
Indices
EURUSD
Commodities
GBPUSD
NZDUSD
Prop
Fair Value Gap
Crypto
Stocks
XAUUSD
NAS100
USDJPY
Produk yang tersedia melalui cTrader Store, termasuk bot dagangan, indikator dan plugin, disediakan oleh pembangun pihak ketiga dan diberikan akses untuk tujuan maklumat dan teknikal sahaja. cTrader Store bukan broker dan tidak memberikan nasihat pelaburan, syor peribadi atau sebarang jaminan prestasi masa hadapan.
Lebih banyak produk daripada penulis ini


Harga
Sejak 22/10/2025
303.42M
Volum yang didagangkan
49
Pip dimenangi
1
Jualan