Penerangan
Kami berpindah ke 👉 PrimeQuant
🚫🚫🚫 Jangan beli penunjuk ini!
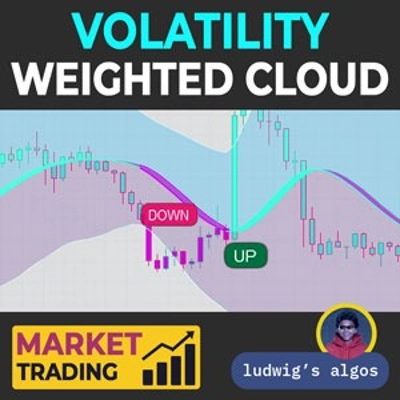
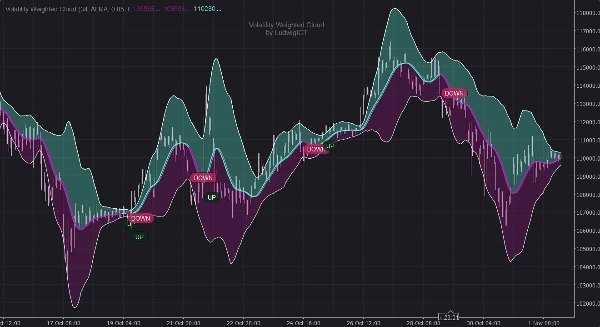
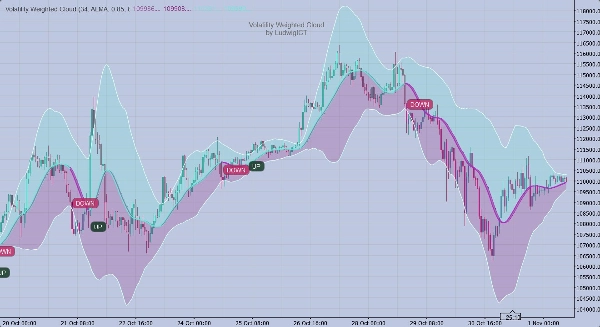
Awan Berbobot Volatiliti — oleh LudwigICT
Cara yang bersih dan visual untuk membaca trend, momentum, dan volatiliti dalam satu pandangan. Awan menyesuaikan dengan kelajuan pasaran dan mencetak TAG TUKAR NAIK/TURUN yang jelas supaya anda boleh bertindak dengan yakin merentas mana-mana simbol atau jangka masa.
Apa yang ia lakukan 🚀
- ⛅ Awan Adaptif: Mengembang dan mengecut dengan volatiliti untuk menunjukkan kekuatan trend dan perubahan rejim.
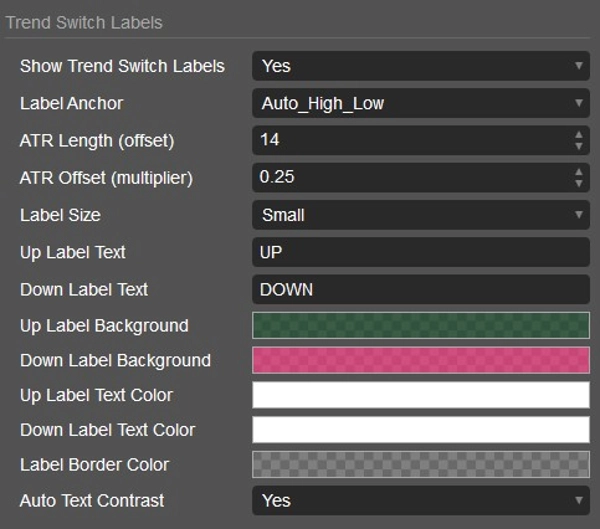
- 🧭 Tag Trend Jelas: Label “NAIK” dan “TURUN” menandakan perubahan momentum di lokasi praktikal pada carta.
- 📏 Jalur Dinamik: Jalur Atas/Bawah bertindak sebagai sokongan/rintangan yang berkembang untuk sasaran, hentian, dan kemasukan semula.
- 🎨 Keterbacaan Tinggi: Warna yang selamat tema dan label berkotak memastikan isyarat boleh dibaca pada mana-mana latar.
- 🔄 Asas & Volatiliti Fleksibel: Pilih gaya pelicinan dan kaedah volatiliti untuk menyesuaikan kelajuan dagangan anda.
- 🧩 Berfungsi Di Mana-mana: Forex, indeks, kripto, komoditi, saham; scalping hingga swing.
Cara menggunakannya 🎯
- Ikut trend: Berdagang mengikut arah label semasa (NAIK = bias panjang, TURUN = bias pendek).
- Kemasukan pullback: Dalam trend NAIK, cari pembelian pada penurunan ke arah Jalur Bawah; dalam trend TURUN, cari jualan berhampiran Jalur Atas.
- Sambungan pecahan: Penutupan melebihi Jalur Atas/Bawah dengan label trend yang sama sering menandakan sambungan.
- Pembingkaian risiko: Gunakan jalur bertentangan sebagai garis pembatalan dinamik; jejak sebahagian sepanjang tengah/asas.
Buku panduan pantas 🧠
- Label NAIK muncul: Utamakan panjang → beli pullback ke dalam awan → keluar secara berperingkat ke dorongan Jalur Atas.
- Label TURUN muncul: Utamakan pendek → jualan pantulan ke dalam awan → keluar secara berperingkat ke dorongan Jalur Bawah.
- Awan menebal & melebar: Volatiliti meningkat—jangkaan ayunan lebih kuat; ketatkan risiko atau ambil sebahagian lebih awal.
- Awan menipis: Momentum menurun—pertimbangkan saiz lebih kecil atau tunggu tag jelas seterusnya.
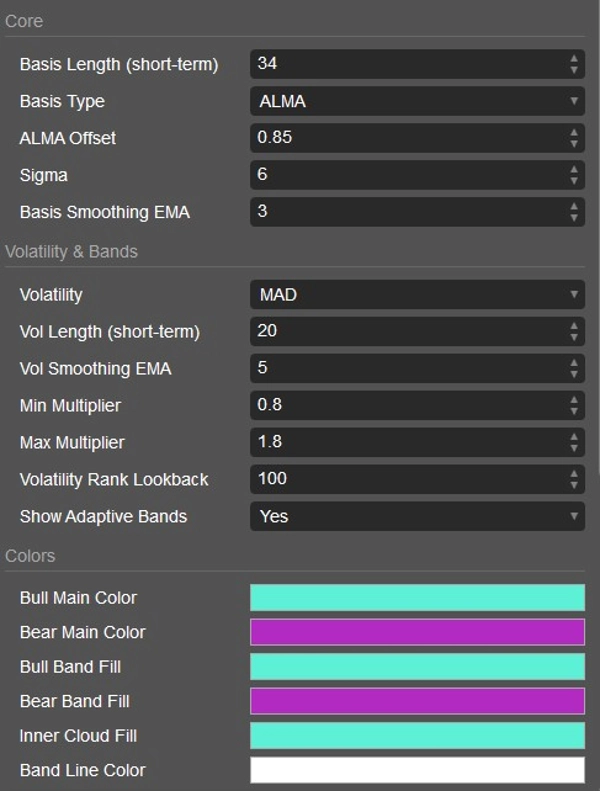
Tetapan utama untuk dicuba ⚙️
- Jenis & Panjang Asas: Tetapkan kepekaan tulang belakang awan (lebih cepat untuk scalping, lebih lambat untuk swing).
- Kaedah Volatiliti & Pelicinan: Stabilkan pasaran bising atau tajamkan isyarat dalam sesi pantas.
- Keterlihatan & Warna Jalur: Hidupkan/matikan jalur dan laraskan warna mengikut tema carta anda untuk kejelasan maksimum.
- Saiz & Penempatan Label: Laraskan saiz label dan offset supaya tag boleh dibaca tanpa menutupi harga.
Amalan terbaik ✅
- Gabungkan dengan struktur (tinggi/rendah, tahap sesi) untuk kemasukan berkemungkinan tinggi.
- Gunakan penyelarasan jangka masa: label TF lebih tinggi untuk bias, awan TF lebih rendah untuk pelaksanaan.
- Urus risiko dahulu: letakkan hentian sedikit melebihi jalur bertentangan atau di luar awan pada kemasukan semula.
Keserasian 🖥️
- Direka untuk carta cTrader, semua simbol dan jangka masa.
- Visual ringan; sesuai untuk dagangan langsung dan main semula.
Jika anda mempunyai sebarang soalan atau menghadapi sebarang masalah, jangan ragu untuk menghubungi saya. Saya gembira untuk membantu Anda!
Penafian:
Dengan menggunakan algoritma saya, anda mengakui bahawa perdagangan melibatkan risiko yang wujud dan prestasi lalu tidak menjamin hasil masa depan. Adalah penting bahawa anda mempunyai strategi pengurusan risiko yang kukuh dan, yang paling penting, anda kekal berdisiplin dalam mematuhi tahap hentian kerugian. Kegagalan mengurus risiko dengan betul boleh menyebabkan kerugian yang besar. Saya tidak bertanggungjawab atas sebarang hasil kewangan yang terhasil daripada penggunaan algoritma ini. Berdagang dengan bertanggungjawab dan sentiasa ikut amalan pengurusan risiko yang betul.
Semoga berjaya! 🙌
Ringkasan
Ulasan pelanggan
5 | 0 % | |
4 | 100 % | |
3 | 0 % | |
2 | 0 % | |
1 | 0 % |


