说明
智能资金概念 — 高级概述
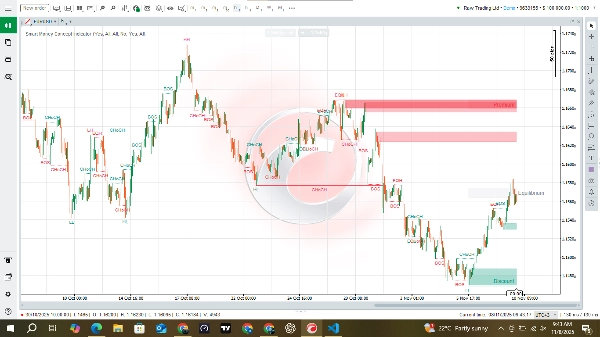
智能资金概念可视化专业/机构活动可能影响价格的位置。它自动识别市场结构(波段和短期结构),突出结构突破(BOS)和特征变化(CHoCH),寻找相等的高点/低点,捕捉候选订单区块范围(大玩家可能下单的区域),并绘制上下文区域(溢价、均衡、折扣)。它适应市场波动性,因此其阈值会随着工具当前的活动进行调整。
交易者一目了然获得的信息
- 清晰的标签显示结构何时翻转或被突破(帮助您确定偏向)。
- 突出显示的订单区块区域 — 价格经常回测的潜在供需口袋。
- 相等的高点/低点标记 — 可能是止损狩猎或回测的流动性节点。
- 上下文区域 — 溢价(昂贵)、均衡(公允价值)、折扣(便宜) — 对偏向和目标有用。
- 跟踪显示近期重要极值的强/弱高点和低点。
为什么这对SMC交易者有用
- 加快水平识别:绘制并存储水平线,避免手动寻找枢轴点和订单区块。
- 一致性:应用相同规则识别结构翻转和订单区块候选,适用于不同工具和时间框架。
- 上下文入场:显示机构兴趣可能所在 — 交易者可在这些区域回测时规划入场,而非盲目猜测。
- 风险框架:区域和订单区块边缘提供合理的止损和目标位置(例如,止损设在订单区块低点/高点之外)。
- 多尺度工作流程:使用更大尺度结构确定偏向,使用较小内部结构实现精准入场。
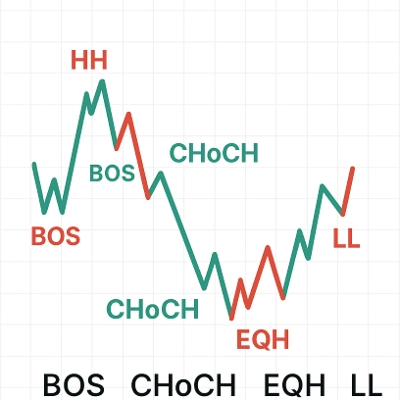
如何解读主要元素
- BOS(结构突破) — 方向延续信号;有助于确认趋势。
- CHoCH(特征变化) — 表明市场行为可能翻转;视为潜在反转或偏向转变。
- 订单区块(OBs) — 价格区间,较大订单可能积累;预期会有回测和拒绝。
- 相等高点/低点 — 流动性积聚的重复水平;通常是大幅波动前的目标。
- 溢价/均衡/折扣 — 简单的价值地图:溢价偏向卖方,折扣偏向买方,均衡为中性/均值。
摘要
指标配置
客户评价
0.0
评价:0
客户评价
该产品尚无评价。已经试过了?抢先告诉其他人!
讨论
常见问答
BTCUSD
Forex
Indices
EURUSD
Commodities
GBPUSD
Prop
SMC
Crypto
Stocks
XAUUSD
NAS100
USDJPY
cTrader Store 提供的所有产品,包括交易机器人、指标和插件,均由第三方开发者提供,仅供信息参考和技术访问之用。cTrader Store 并非经纪商,不提供投资建议、个人推荐或任何未来业绩保证。
该作者的其他作品


价格
注册日期 14/06/2025
1
销售