

説明
🚀 Risk Appetite & Directional Bias ULTRA (cTrader) は、リスクオン / ニュートラル / リスクオフの状態を測定し、それを明確で実行可能な方向性バイアスに変換するために設計されたプロフェッショナルな市場レジーム指標です。単一の市場に依存する代わりに、2つの銘柄(「リスクプロキシ」と「ベンチマーク」)を比較してリアルタイムのリスクスコア(0~100)を構築し、レジームの変化を強調表示し、チャート上のダッシュボード表示で全てを要約します。
🔧 最初の2つのパラメータの意味(およびそれが重要な理由)
🟠 リスク資産シンボル(BTC)
これはリスクプロキシであり、「リスクアペタイトの温度計」として使用される銘柄です。元のコンセプトではビットコインをグローバルなリスクオンのプロキシとして使用しているため「BTC」とラベル付けされていますが、ビットコインを使う必要はありません。リスクセンチメントをよく表す任意の資産(例:BTC、NASDAQ/US100、高ベータ指数など)に設定できます。
🔵 ベンチマークシンボル(SP/US500)
これは、マクロバイアスを追跡したい参照市場(ベンチマーク)です。通常はUS500/SPX500ですが、あなたが主要な「コンテキストドライバー」と考える任意の銘柄にできます。
✅ 要するに:
- リスク資産 = センチメントセンサー(リスクアペタイトの源)
- ベンチマーク = バイアスが反映されるべき参照市場
❓ ビットコインで使わなければいけませんか?
いいえ。目的に応じて異なる使い方ができます:
✅ A) マクロの「クラシック」リスクオン/リスクオフ(推奨)
- リスク資産: BTCUSD
- ベンチマーク: US500 / SPX500
これによりグローバルなリスクレジームの明確なビューが得られます。
✅ B) マクロコンテキストでビットコイントレード
- リスク資産: BTCUSD
- ベンチマーク: US500(または他のマクロ参照)
これによりマクロ条件がBTCを支持または反対するタイミングを理解できます。
✅ C) マルチ資産 / カスタム市場関係
- リスク資産: BTC または US100
- ベンチマーク: フィルターしたい市場(GER40、XAUUSDなど)
これによりインジケーターが柔軟な「センチメントエンジン」になります。
⚙️ 動作の仕組み(コアロジック)
モデルは両方のシンボルで以下を計算します:
📈 リターン(%)(安定性向上のために対数も選択可能)
📊 ボラティリティ(選択されたルックバック期間の標準偏差)
🔗 ローリング相関(2つのリターン系列間)
🎛️ 動的ウェイトは以下に基づいてリスクプロキシの影響力を調整します:
- 相関の強さ
- 相対的なボラティリティ
これにより、調整済み変化量シグナルが生成されます。これは:
- EMAで平滑化
- 正規化されて0~100のリスクスコアになります
📊 読み方(最も重要なシグナル)
🎯 リスクスコア(0~100)はあなたの主要なコンパスです:
🟢 リスクオン(上限閾値を超えるスコア、例:> 60)
→ リスクアペタイトが強く、環境はしばしばモメンタムやリスク資産を好みます
🔵 ニュートラル(下限と上限の閾値の間、例:40~60)
→ 移行期/もみ合い/混合シグナル、フィルタリング推奨
🔴 リスクオフ(下限閾値未満のスコア、例:< 40)
→ 防御的な環境で注意が高まり、下落リスクがしばしば高まります
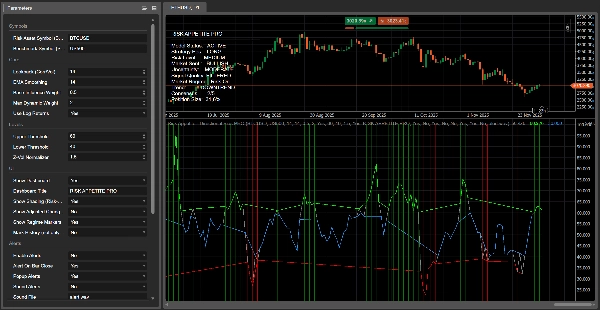
🔴 赤いラインが「途切れる」理由(およびその意味)
このULTRAバージョンでは、可視化は意図的で「レジームベース」です:
- 常に表示される連続したベースライン(グレー)があります
- 色付きオーバーレイはそれぞれのレジームでのみ表示されます:
-
- 赤のオーバーレイはリスクオフの間のみ表示されます
- 緑のオーバーレイはリスクオンの間のみ表示されます
- 青のオーバーレイはニュートラルの間に表示されます
したがって、市場がリスクオフを離れてニュートラル(またはリスクオン)に移行すると、赤いオーバーレイは空(NaN)になり、cTraderは描画を停止します—これが「途切れている」ように見える理由です。✅
📌 重要:これは自動的に弱気トレンドが「終了」したことを意味しません。
モデルがもはや強く、確定的なリスクオフ状態を検出していないことを意味し、弱気の優位性は減少し、市場はおそらく移行期にある可能性があります。
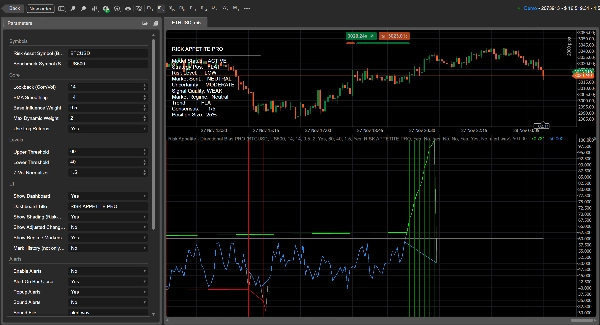
🖥️ チャート上の表示(ダッシュボード)の目的 — 行ごとの説明
ダッシュボードはあなたのリアルタイム意思決定パネルです。レジーム、信頼度、戦術的ガイダンスを要約し、ラインだけで推測する必要をなくします。
✅ モデルステータス
モデルが正しく動作しているかを示します。
- ACTIVE = 有効なデータが利用可能で計算が正しい
- NO DATA = シンボルデータが欠落、シンボル名が間違っている、または履歴/時間の整合性が不足
🎯 戦略ポジション(Strategy Pos)
レジームに基づく推奨スタンス:
- ロング = リスクオン
- ショート = リスクオフ
- フラット = ニュートラル
⚠️ リスクレベル
市場のボラティリティと不確実性に基づくリスク強度の測定値。
- 非常に低い / 低い = より安定した状態
- 中程度 = 通常
- 高い / 非常に高い = ノイズが多く、鞭打ちリスクが高い;サイズを減らすか、より強い確認を要求
🧠 市場センチメント
スコアレベルから導出される方向性トーン:
- 強気 / 弱気 / ニュートラル
🌫️ 不確実性
モデルの「明確さ」を示します。以下の場合に増加します:
- 相関が弱まる、または
- ボラティリティが上昇(より不安定な環境)
レベル: 低 / 中程度 / 高
🧪 シグナル品質
以下に基づく総合評価:
- シグナル強度(50からの距離)
- 不確実性レベル
出力: 強い / フィルタ済み / 弱い
🔥 市場レジーム
主な分類:
- リスクオン / ニュートラル / リスクオフ
これは色付きオーバーレイ、シェーディング、ポジションバイアスを駆動するコアのレジーム状態です。
📉 トレンド
スコアの短期方向(傾き):
- アップトレンド = リスクアペタイト上昇中
- ダウントレンド = リスクアペタイト下降中
- フラット = 横ばい / 低モメンタム
🗳️ コンセンサス(X/5)
方向、傾き、相関整合などの主要条件がいくつ一致しているかをカウントする単純な整合スコア。
高いほど、よりクリーンで一貫した環境。
📏 ポジションサイズ
シグナル強度と不確実性に基づく推奨エクスポージャー割合:
- 強くて不確実性が低い → サイズ推奨が高い
- 弱いか不確実 → サイズ推奨が小さい
🧭 マルチタイムフレームの利点(実際に非常に強力)
同じ市場を複数のタイムフレームで分析すると、インジケーターはタイムフレームごとに更新・再調整されます。これにより以下が簡単に見つけられます:
✅ タイムフレームの整合(より強いシグナル)
✅ タイムフレームの対立(しばしばよりニュートラル/もみ合いの状態)
高いタイムフレームはマクロレジームを定義し、低いタイムフレームはそのレジーム内でのエントリータイミングを助けます。
📌 マーカー、アラート&通知(ULTRA機能)
✨ レジームマーカーはレジームが変わるとチャートに表示されます:
- リスクオン ↔ ニュートラル ↔ リスクオフ
これにより移行が即座に見えるようになります。
🔔 アラート&通知を有効にすると以下を受け取れます:
- ポップアップアラート(オプションで音付き)
- バークローズ時のアラート(ローソク足形成中の誤発動を避けるため推奨)
💬 私たちの(最適化+プリセット+ツール)に参加しませんか
このインジケーターの最高のパフォーマンスを求めるなら、Discordに参加してください:
✅ ブローカー銘柄向けパラメータ最適化
✅ すぐに使えるプリセット(暗号通貨 / 指数 / FX)
✅ マルチタイムフレーム設定ガイダンス
✅ シグナルフィルタリングと実行品質を向上させる高度なツールとアップデート
概要
カスタマーレビュー
5 | 100 % | |
4 | 0 % | |
3 | 0 % | |
2 | 0 % | |
1 | 0 % |


