Описание
Профессиональный анализ объема на основе диапазонов с интеллектуальным расчетом дельты свечей
Откройте для себя силу точного анализа объема с помощью RANGE DELTA CANDLE VOLUME PROFILE — лучшего индикатора профиля объема на основе диапазонов для cTrader. Разработанный для трейдеров, которым нужен гибкий и точный анализ объема по произвольным временным диапазонам, этот индикатор предоставляет инсайты институционального уровня благодаря интеллектуальному расчету дельты на основе свечей.
🎯 ОСНОВНЫЕ ХАРАКТЕРИСТИКИ
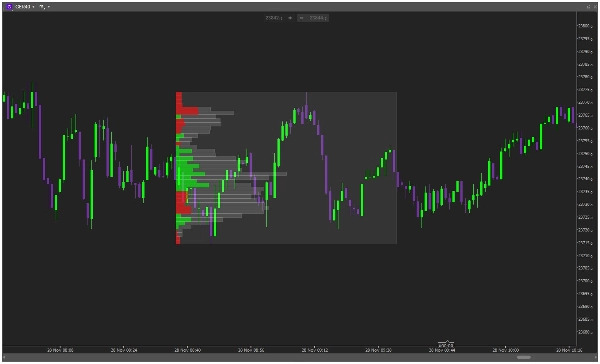
🏓 ГИБКОЕ ЯКОРЕНИЕ ДИАПАЗОНА
- Используйте трендовые линии для определения ЛЮБОГО произвольного временного диапазона
- Динамическое создание профиля между выбранными точками
- Обновления в реальном времени по мере развития рынка
- Варианты якорения слева или справа
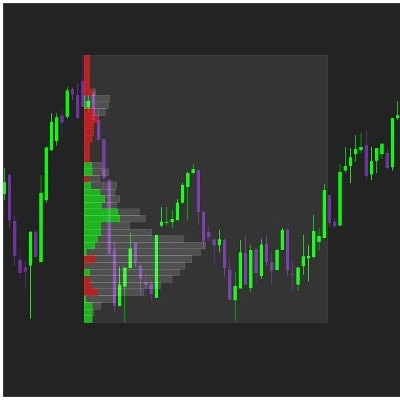
📊 ИНТЕЛЛЕКТУАЛЬНЫЙ АНАЛИЗ ДЕЛЬТЫ НА ОСНОВЕ СВЕЧЕЙ
- Продвинутый расчет дельты на основе направления свечи
- Зеленые свечи = объем покупок | Красные свечи = объем продаж
- Чистая визуализация одним цветом на каждом ценовом уровне
- Мгновенное определение зон накопления/распределения
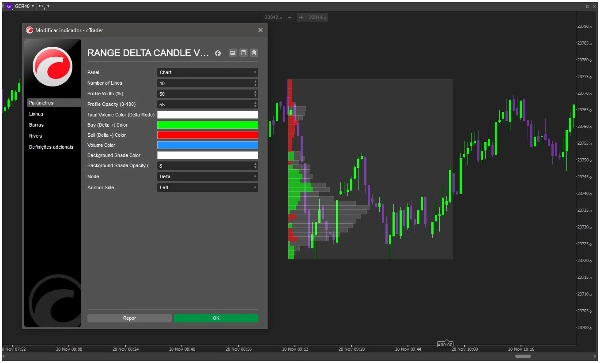
🎨 ПОЛНОСТЬЮ НАСТРАИВАЕМЫЙ ДИСПЛЕЙ
- Регулируемое количество корзин/линий (5-100)
- Настраиваемая ширина профиля (5-300% от диапазона)
- Полный контроль цвета для объема покупок/продаж/общего объема
- Настройки прозрачности и непрозрачности
⚡ ДВА РЕЖИМА ОТОБРАЖЕНИЯ
- Режим Дельты: Визуализация чистого давления покупок/продаж
- Режим Объема: Традиционное отображение профиля объема
- Выбор якорения слева или справа
🚀 ПОЧЕМУ ТРЕЙДЕРЫ ВЫБИРАЮТ ИМЕННО ЕГО
"Гибкость анализа любого произвольного диапазона меняет правила игры. Идеально для анализа сессий и ключевых движений рынка." - Профессиональный дневной трейдер
"Наконец-то профиль объема на основе диапазона, который действительно имеет смысл. Дельта на основе свечей невероятно точна." - Свинг-трейдер
📈 ИДЕАЛЬНО ДЛЯ
- Анализа сессий - Анализ конкретных торговых сессий (Лондон, Нью-Йорк, Азия)
- Торговли на основе событий - Изучение объема вокруг новостных событий и экономических данных
- Технического анализа - Подтверждение поддержки/сопротивления с помощью объема
- Структуры рынка - Определение зон стоимости и объемных разрывов
🛠 ПРОСТО В ИСПОЛЬЗОВАНИИ
- Нарисуйте трендовую линию между начальной и конечной точками
- Наблюдайте как профиль объема генерируется автоматически
- Анализируйте распределение дельты по вашему произвольному диапазону
- Торгуйте с уровнями и инсайтами, подтвержденными объемом
🔧 ТЕХНИЧЕСКИЕ ХАРАКТЕРИСТИКИ
- Расчет и обновления в реальном времени
- Низкое потребление ресурсов
- Совместимость со всеми таймфреймами
- Работает со всеми торговыми инструментами
📋 ВАРИАНТЫ НАСТРОЙКИ
- Количество корзин/линий
- Процент ширины профиля
- Управление непрозрачностью (0-100%)
- Пользовательские цветовые схемы
- Выбор стороны якорения (слева/справа)
- Режим отображения (Дельта/Объем)
🎯 ПОВЫСЬТЕ ЭФФЕКТИВНОСТЬ АНАЛИЗА РЫНКА УЖЕ СЕГОДНЯ!
Присоединяйтесь к профессиональным трейдерам по всему миру, которые преобразовали свой анализ рынка с помощью RANGE DELTA CANDLE VOLUME PROFILE. Перестаньте использовать жесткие инструменты с фиксированным диапазоном и начните анализировать объем именно там, где это нужно.
⭐ "Возможность анализировать произвольные диапазоны с точным расчетом дельты полностью изменила мой подход к структуре рынка. Незаменимый инструмент!"
Добавьте RANGE DELTA CANDLE VOLUME PROFILE в вашу платформу cTrader уже сегодня и овладейте анализом объема в любых рыночных условиях!
🆚 ПОЧЕМУ ВЫБРАТЬ ИМЕННО ЕГО, А НЕ ДРУГИЕ ПРОФИЛИ ОБЪЕМА?
- ✅ Истинная гибкость - Анализ ЛЮБОГО произвольного временного диапазона
- ✅ Точная дельта - Расчет на основе свечей для надежных результатов
- ✅ Профессиональная визуализация - Чистое отображение институционального уровня
- ✅ Реальная настройка - Полный контроль над всеми визуальными аспектами
- ✅ Проверенная методология - Основана на принципах профессиональной торговли
Преобразуйте анализ графиков с помощью мощи гибкого профилирования объема на основе диапазонов!


