
Penerangan
✅ UATKit disediakan secara percuma sebagai sumbangan niat baik kepada komuniti cTrader, yang dicipta oleh seorang pedagang profesional yang memahami cabaran harian dalam analisis carta dan pelaksanaan.
⚠️Sila semak halaman produk secara berkala untuk kemas kini, kerana cTrader tidak memberitahu pengguna apabila versi baru penunjuk dikeluarkan.
⭐️ Saya juga gembira menerima komen dan maklum balas anda dalam Ulasan Pelanggan dan Perbincangan bahagian.
1. Apakah Produk Ini
Satu set alat peningkatan aliran kerja yang komprehensif direka untuk menjadikan carta pada cTrader lebih lancar, jelas, dan lebih cekap.
Universal Assistant Toolkit (UATKit) adalah teman sisi carta berbilang ciri untuk cTrader.
Ia menggabungkan beberapa alat praktikal - setiap satu direka untuk menyelesaikan keperluan aliran kerja tertentu - ke dalam satu penunjuk ringan yang bersatu.
Setiap ciri dalam UATKit boleh disesuaikan sepenuhnya dan beroperasi secara bebas, memberikan pedagang kawalan penuh untuk melaraskan tingkah laku, visual, dan kekunci panas sambil mengaktifkan hanya alat yang mereka perlukan untuk pengalaman carta yang bersih dan responsif.
UATKit disediakan secara percuma sebagai sumbangan niat baik kepada komuniti cTrader, yang dicipta oleh seorang pedagang profesional yang memahami cabaran harian dalam analisis carta dan pelaksanaan.
2. Siapa Toolkit Ini Untuk
UATKit dibina untuk pedagang yang:
- Menghabiskan masa yang banyak menganalisis carta
- Mengutamakan susun atur carta yang bersih, informatif, dan boleh disesuaikan
- Mahukan akses lebih pantas kepada tindakan biasa melalui kekunci panas
- Memerlukan kejelasan visual semasa pasaran bergerak pantas
- Menghargai alat yang meningkatkan aliran kerja tanpa menambah kekacauan
Sama ada anda scalping, swing trade, atau hanya mahukan persekitaran carta yang lebih teratur, UATKit menyesuaikan dengan gaya anda.
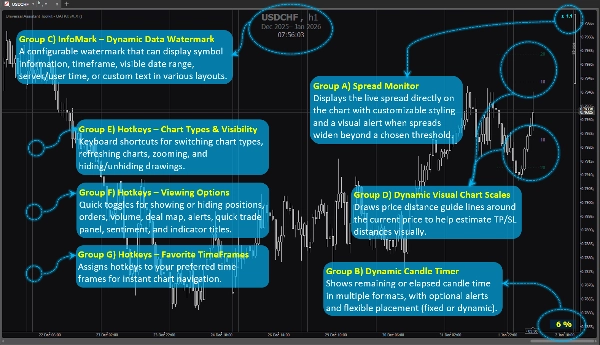
3. Gambaran Keseluruhan Kumpulan Ciri
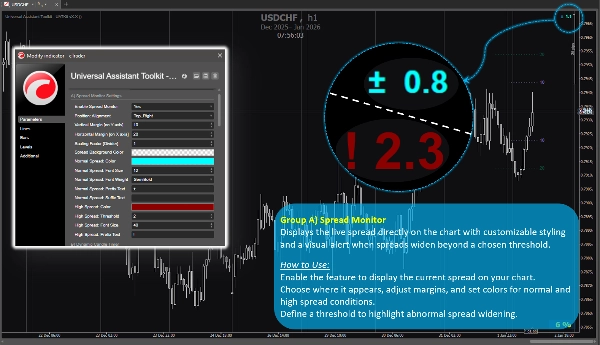
Kumpulan Ciri A) 🔸 Monitor Spread
Memaparkan spread langsung terus pada carta dengan gaya yang boleh disesuaikan dan amaran visual apabila spread melebar melebihi ambang yang dipilih.
Cara Menggunakan:
Aktifkan ciri untuk memaparkan spread semasa pada carta anda.
Pilih di mana ia muncul, laraskan margin, dan tetapkan warna untuk keadaan spread biasa dan tinggi.
Tentukan ambang untuk menyerlahkan pelebaran spread yang luar biasa.
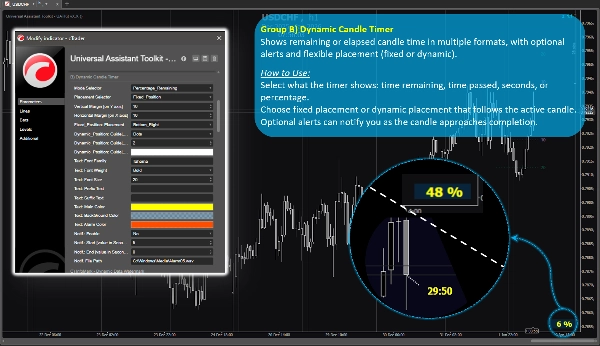
Kumpulan Ciri B) 🔸 Pemasa Lilin Dinamik
Menunjukkan masa lilin yang tinggal atau berlalu dalam pelbagai format, dengan amaran pilihan dan penempatan fleksibel (tetap atau dinamik).
Cara Menggunakan:
Pilih apa yang dipaparkan oleh pemasa: masa tinggal, masa berlalu, saat, atau peratusan.
Pilih penempatan tetap atau penempatan dinamik yang mengikuti lilin aktif.
Amaran pilihan boleh memberitahu anda apabila lilin hampir selesai.
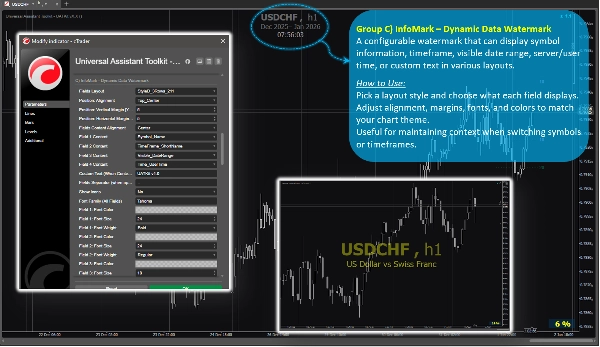
Kumpulan Ciri C) 🔸 InfoMark – Tanda Air Data Dinamik
Tanda air yang boleh dikonfigurasi yang boleh memaparkan maklumat simbol, jangka masa, julat tarikh yang kelihatan, masa pelayan/pengguna, atau teks tersuai dalam pelbagai susun atur.
Cara Menggunakan:
Pilih gaya susun atur dan pilih apa yang dipaparkan oleh setiap medan.
Laraskan penjajaran, margin, fon, dan warna untuk padankan tema carta anda.
Berguna untuk mengekalkan konteks apabila menukar simbol atau jangka masa.
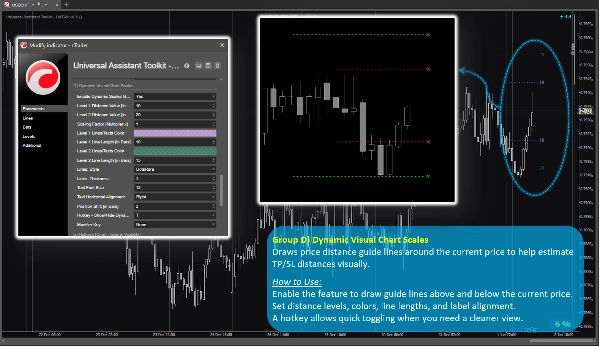
Kumpulan Ciri D) 🔸 Skala Carta Visual Dinamik
Melukis garis panduan jarak harga di sekitar harga semasa untuk membantu menganggarkan jarak TP/SL secara visual.
Cara Menggunakan:
Aktifkan ciri untuk melukis garis panduan di atas dan di bawah harga semasa.
Tetapkan tahap jarak, warna, panjang garis, dan penjajaran label.
Kekunci panas membolehkan penukaran pantas apabila anda memerlukan pandangan yang lebih bersih.
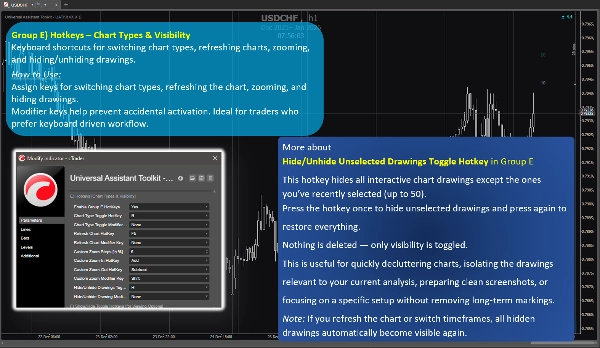
Kumpulan Ciri E) 🔸 Kekunci Panas – Jenis Carta & Kebolehlihatan
Pintasan papan kekunci untuk menukar jenis carta, menyegarkan carta, mengezum, dan menyembunyikan/menunjukkan lukisan.
Cara Menggunakan:
Tetapkan kekunci untuk menukar jenis carta, menyegarkan carta, mengezum, dan menyembunyikan lukisan.
Kekunci pengubah membantu mengelakkan pengaktifan tidak sengaja. Sesuai untuk pedagang yang mengutamakan aliran kerja berasaskan papan kekunci.
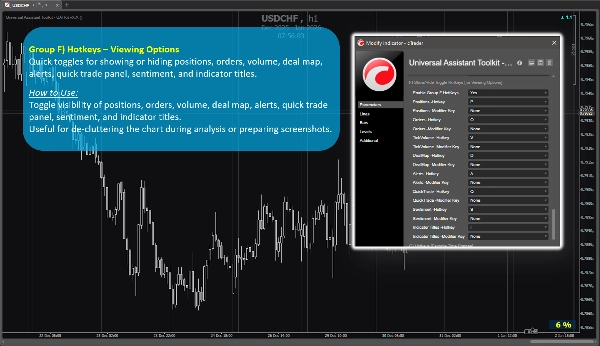
Kumpulan Ciri F) 🔸 Kekunci Panas – Pilihan Paparan
Togol pantas untuk menunjukkan atau menyembunyikan posisi, pesanan, volum, peta urus niaga, amaran, panel perdagangan pantas, sentimen, dan tajuk penunjuk.
Cara Menggunakan:
Togol kebolehlihatan posisi, pesanan, volum, peta urus niaga, amaran, panel perdagangan pantas, sentimen, dan tajuk penunjuk.
Berguna untuk mengurangkan kekacauan carta semasa analisis atau menyediakan tangkapan skrin.
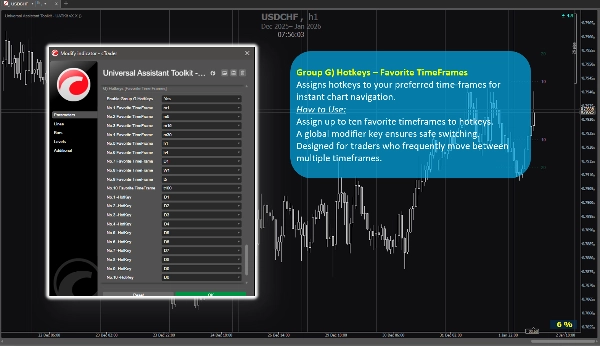
Kumpulan Ciri G) 🔸 Kekunci Panas – Jangka Masa Kegemaran
Menetapkan kekunci panas kepada jangka masa pilihan anda untuk navigasi carta segera.
Cara Menggunakan:
Tetapkan sehingga sepuluh jangka masa kegemaran kepada kekunci panas.
Kekunci pengubah global memastikan penukaran yang selamat.
Direka untuk pedagang yang kerap bergerak antara pelbagai jangka masa.
4. Nota Tambahan untuk Pengguna
- Semua ciri adalah pilihan dan boleh diaktifkan atau dinyahaktifkan secara individu.
- Toolkit dioptimumkan untuk prestasi dan direka untuk mengelakkan gangguan dengan penunjuk lain.
- Kebanyakan parameter termasuk tooltip terbina dalam. Hanya letakkan kursor di atas mana-mana tetapan untuk melihat panduan tambahan dan nota penggunaan.
- Tiada sumber data luaran digunakan; semua maklumat datang dari carta dan platform.
- Toolkit ini disediakan secara percuma untuk menyokong komuniti cTrader dan memperbaiki aliran kerja carta harian.
- Tetapan lalai adalah munasabah, jadi pengguna yang tidak memerlukan konfigurasi khas boleh bergantung pada parameter yang telah ditetapkan tanpa menghabiskan masa tambahan untuk penyediaan.
- ⭐️ Maklum balas dan cadangan dialu-alukan untuk membantu memperhalusi versi akan datang (gunakan bahagian perbincangan di halaman ini).
- ⚠️Sila semak halaman produk secara berkala untuk kemas kini, kerana cTrader tidak memberitahu pengguna apabila versi baru penunjuk dikeluarkan.
Ringkasan
Key features include:
- **Spread Monitor:** Displays live spread on the chart with customizable visuals and alerts for spread widening.
- **Dynamic Candle Timer:** Shows remaining or elapsed candle time in various formats, with optional alerts and flexible positioning.
- **InfoMark Watermark:** Configurable watermark displaying symbol info, timeframe, date range, server/user time, or custom text.
- **Dynamic Visual Chart Scales:** Price-distance guide lines around current price to estimate take-profit/stop-loss distances visually.
- **Hotkeys for Chart Types & Visibility:** Keyboard shortcuts for switching chart types, refreshing, zooming, and toggling drawing visibility.
- **Hotkeys for Viewing Options:** Quick toggles for positions, orders, volume, deal map, alerts, quick trade panel, sentiment, and indicator titles.
- **Hotkeys for Favorite TimeFrames:** Assign up to ten favorite timeframes to hotkeys for instant navigation.
All features are optional and configurable, optimized for performance without interfering with other indicators. UATKit supports various markets including Forex, indices, commodities, crypto, and stocks. It is intended for traders who seek a clean, customizable, and efficient charting environment with enhanced workflow controls.
Ulasan pelanggan
5 | 100 % | |
4 | 0 % | |
3 | 0 % | |
2 | 0 % | |
1 | 0 % |


