
Penerangan
🚀Unjuran Harga Isyarat Ayunan: 📈
https://chartshots.spotware.com/c/6980f0f0287fb
The Price Projection Swing Volume adalah alat ramalan maju yang direka untuk memetakan laluan masa depan yang paling mungkin bagi aset berdasarkan ayunan harga terkini dan nisbah harmonik Fibonacci. Ia mengenal pasti julat pasaran semasa dan meramalkan "peta jalan" berperingkat untuk potensi tindakan harga.
🔍 Analisis & Keadaan Pasaran
https://chartshots.spotware.com/c/6980f104dab21
Algoritma ini menumpukan pada mengenal pasti "Amplop Pasaran" dengan menganalisis:
- Titik Ayunan Ekstrem: Ia mengimbas Tempoh Kembali Lihat tertentu (contohnya, 50 bar terakhir) untuk mencari Tinggi Tertinggi dan Rendah Terendah mutlak.
- Zon Penarikan Semula: Ia secara automatik mengira dan melakar lima tahap Fibonacci utama (23.6%, 38.2%, 50%, 61.8%, dan 78.6%) dalam ayunan semasa untuk mengenal pasti kawasan yang menarik.
- Unjuran Harmonik: Menggunakan Nisbah Unjuran (lalai 0.618), algoritma mengira laluan masa depan tiga segmen berdasarkan pergerakan yang diukur dari titik ayunan terkini.
🟢 Cara Mentafsir Isyarat & Visual
https://chartshots.spotware.com/c/6980f126d875a
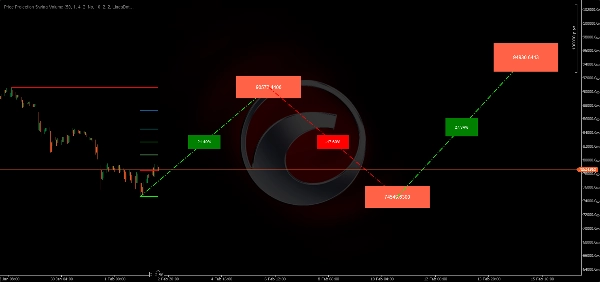
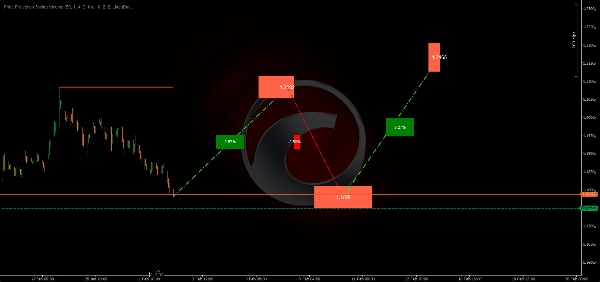
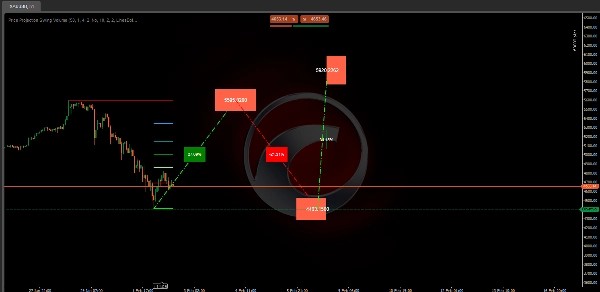
- Garis Ayunan Mendatar: Garis Merah Tebal (Tinggi) dan Hijau (Rendah) mewakili sempadan pasaran semasa. Harga yang melepasi ini sering menandakan perubahan tren.
- Laluan Unjuran (Garis Berbintik): Garis serong meramalkan pergerakan "zigzag". Ini adalah ramalan algoritma tentang bagaimana harga mungkin bergerak untuk mencapai sasaran akhirnya.
- Label Peratusan: Terletak pada garis serong, ini menunjukkan jangkaan % keuntungan atau kerugian untuk segmen pergerakan tersebut.
- Kotak Harga Sasaran: Kotak berwarna di hujung setiap segmen memberikan tahap harga tepat yang disasarkan oleh algoritma.
⚙️ Tetapan & Parameter Utama
- Tempoh Kembali Lihat (50): Menentukan skala ayunan. Nombor yang lebih tinggi mencari ayunan "Makro", manakala nombor yang lebih rendah menumpukan pada ayunan "Mikro" scalping.
- Nisbah Unjuran (0.618): "Nisbah Emas" ini menentukan kedalaman dan ketinggian zigzag yang dijangka. Anda boleh melaraskan ini untuk sasaran yang lebih atau kurang agresif.
- Penyesuaian Visual: Warna boleh disesuaikan sepenuhnya untuk unjuran Bullish/Bearish dan tahap Fibonacci tertentu agar sesuai dengan tema carta anda.
🚀 Kes Penggunaan & Senario Tipikal
- Penetapan Sasaran: Gunakan kotak harga yang dijangka untuk menetapkan tahap Ambil Untung bagi dagangan ayunan.
- Menjangka Pembalikan: Jika unjuran menunjukkan penarikan semula yang mendalam sebelum pergerakan naik, pedagang boleh menunggu harga mencapai garis berbintik "lembah" sebelum masuk.
- Pergerakan Diukur: Sangat sesuai untuk pedagang yang mengikuti corak "ABCD" atau tindakan harga harmonik.
👤 Profil Pedagang Sasaran
- Pedagang Ayunan & Tren: Sesuai untuk mereka yang memegang posisi selama beberapa hari dan memerlukan peta jalan rintangan potensi.
- Pedagang Harmonik: Sesuai untuk pengguna yang bergantung pada nisbah Fibonacci tetapi mahu pengiraan dilakukan secara automatik.
- Tahap Pengalaman: Sederhana. Pedagang harus memahami bahawa ini adalah unjuran dan harus digunakan bersama pengesahan lain.
⚠️ Had & Nota Penggunaan Penting
- Kemas Kini Dinamik: Unjuran dan tahap ayunan akan "bergeser" secara masa nyata jika Tinggi atau Rendah baru dicipta dalam tetingkap kembali lihat.
- Inisialisasi: Penunjuk memerlukan jumlah sejarah minimum (sama dengan Tempoh Kembali Lihat) sebelum ia boleh mula melakar dengan tepat.
Ringkasan
The indicator visually displays horizontal swing boundary lines (red for highs, green for lows), dotted diagonal projection lines with percentage gain or loss labels, and target price boxes indicating exact projected price levels. These features help traders set take profit targets, anticipate retracements or reversals, and identify measured moves consistent with harmonic patterns.
Key customizable settings include the lookback period for swing scale, projection ratio for target aggressiveness, and visual color options for bullish/bearish projections and Fibonacci levels. The indicator updates dynamically as new highs or lows form within the lookback window and requires sufficient historical data to initialize.
Price Projection Swing Volume supports multiple markets including BTCUSD, EURUSD, GBPUSD, NZDUSD, XAUUSD, NAS100, and USDJPY, making it suitable for traders using Fibonacci-based harmonic strategies and swing trading approaches.


