
Penerangan
cTrader Spread & Cost Overlay adalah penunjuk ringan yang direka untuk memvisualisasikan kos perdagangan masa nyata terus pada carta.
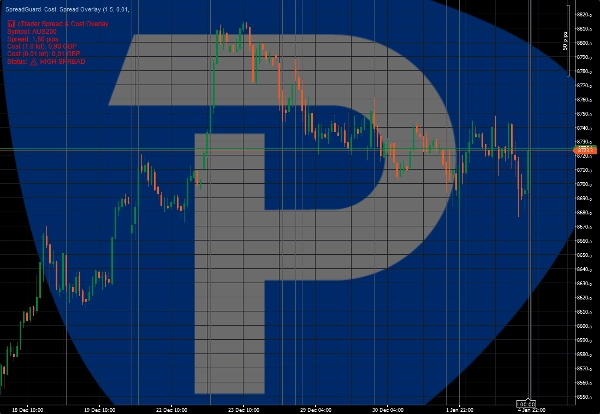
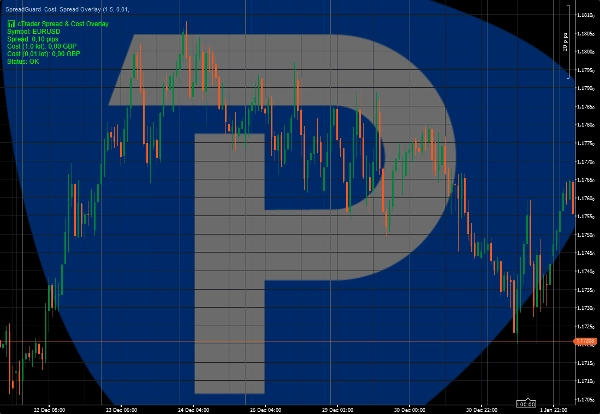
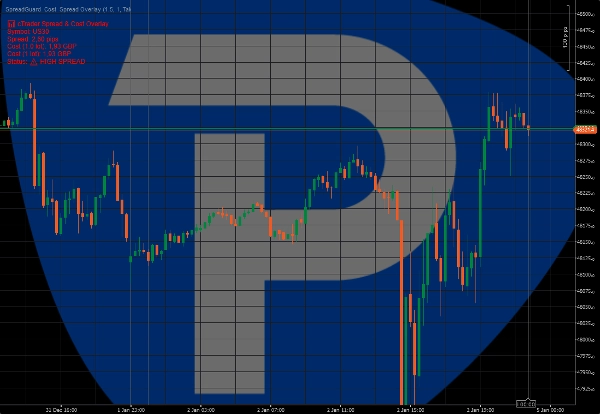
Penunjuk ini menunjukkan spread semasa dalam pips dan mengira anggaran kos perdagangan berdasarkan saiz lot yang dipilih. Amaran visual menonjolkan tempoh spread tinggi, membantu pedagang mengelakkan keadaan pelaksanaan yang tidak menguntungkan.
Ciri-ciri utama:
• Paparan spread langsung (pips)
• Anggaran kos perdagangan untuk saiz lot yang dipilih
• Amaran visual apabila spread melebihi ambang yang ditetapkan
• Lapisan bersih pada carta
Penunjuk ini tidak meletakkan perdagangan atau menjana isyarat perdagangan.
Ia bertujuan sebagai alat kesedaran pelaksanaan dan risiko untuk pedagang manual.
Sesuai untuk scalper, pedagang intraday, dan akaun firma prop.
*Harga akses awal. Kemas kini masa depan mungkin dikeluarkan pada harga biasa yang lebih tinggi.
Ringkasan
Ulasan pelanggan
5 | 0 % | |
4 | 100 % | |
3 | 0 % | |
2 | 0 % | |
1 | 0 % |