Precision FVG Analysis - プロフェッショナルフェアバリューギャップインジケーター
概要
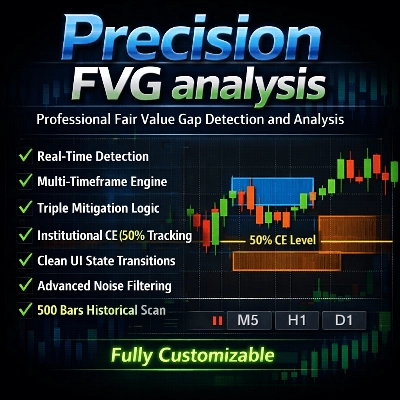
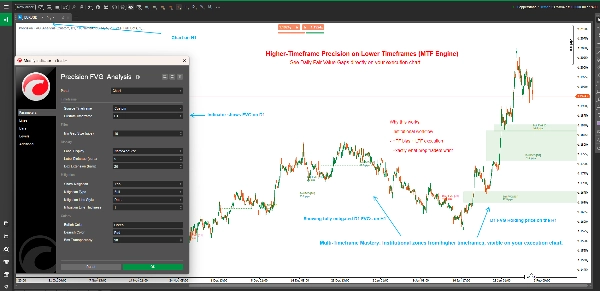
Precision FVG Analysis は、スマートマネーコンセプト(SMC)およびICT手法を利用する真剣なトレーダー向けに設計された強力で柔軟なフェアバリューギャップ(FVG)検出インジケーターです。この高度なインジケーターは、複数の時間軸にわたるフェアバリューギャップを自動的に識別、追跡、視覚化し、高度な緩和追跡機能を備えています。
フェアバリューギャップは、価格が急速に動いたために市場に不均衡が生じ、効率性の欠如が残る部分を表しており、これらはしばしば再訪されます。これらのギャップを理解し取引することは、現代のプライスアクショントレーダーにとって非常に重要です。
主な特徴
🎯 マルチタイムフレーム分析
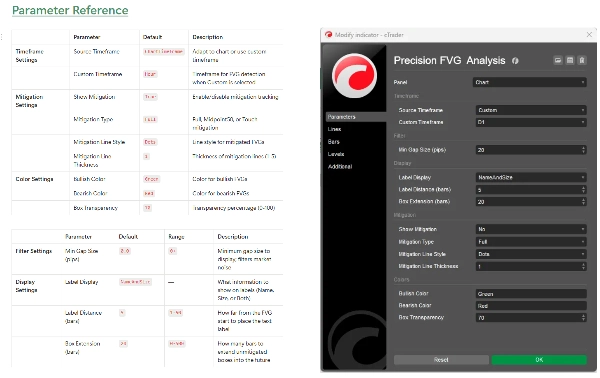
- 適応型時間軸検出: 現在のチャート時間軸または任意のカスタム時間軸からFVGを表示する選択が可能
- クロスタイムフレーム取引: より高い時間軸のFVGを低い時間軸のチャートで表示し、取引の文脈を向上
- スマート時間軸ラベル: カスタム時間軸使用時にラベルで自動的に時間軸を識別
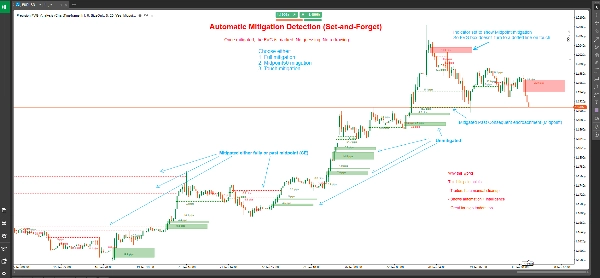
📊 高度な緩和追跡
- 三つの緩和タイプ:
-
- 完全緩和: 価格がギャップ全体を完全に埋める(最も保守的)
- 50% 中間点(CE): 価格がConsequent Encroachmentレベルに達する(バランスの取れたアプローチ)
- タッチ緩和: 価格がギャップの境界に触れる(最も敏感)
- 視覚的状態変化: 緩和されていないFVGは塗りつぶしボックスで表示され、緩和されたFVGは点線に変わる
- 正確な緩和マーク: 緩和が発生した正確なローソク足を表示
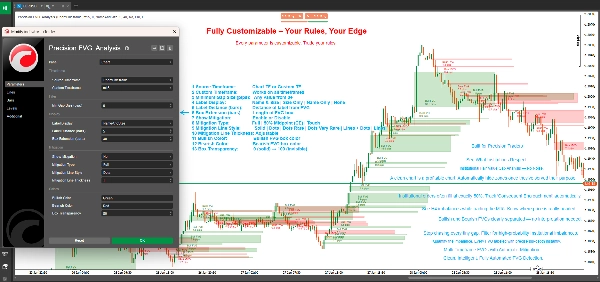
🎨 完全カスタマイズ可能な表示
- 柔軟なボックス延長: FVGボックスが未来にどれだけ延長されるかを制御(0-500バー)
- スマートラベリングシステム: 4つのラベルモードから選択可能:
-
- 名前とサイズ: FVGタイプとピップサイズの詳細表示
- サイズのみ: ギャップサイズのみピップで表示
- 名前のみ: FVGタイプの識別
- なし: ラベルなしのクリーンなチャート
- カスタムカラー: ブル(買い)とベア(売り)のカラースキームを分ける
- 調整可能な透明度: ボックスの透明度を0-100%で設定可能
- 緩和ラインのカスタマイズ: 緩和されたFVGのラインスタイルと太さを選択可能
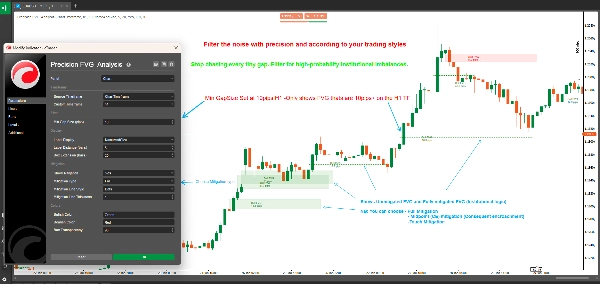
⚙️ プロフェッショナルフィルタリング
- 最小ギャップサイズフィルター: 重要でないギャップを除外するための最小ピップ要件を設定
- 自動検出: 新しいローソク足のクローズごとにリアルタイムでFVGを識別
- 履歴スキャン: 初期化時に最大500本の過去バーを自動スキャン
フェアバリューギャップとは?
フェアバリューギャップ(FVG)は、3本の連続したローソク足の間に価格の非効率性がある場合に発生します:
ブルッシュFVG: 現在のローソク足の安値が2本前のローソク足の高値より高く、中間のローソク足がその高値を上回ってクローズすると形成されます。これは上向きのギャップを作り、しばしばサポートとして機能します。
ベアリッシュFVG: 現在のローソク足の高値が2本前のローソク足の安値より低く、中間のローソク足がその安値を下回ってクローズすると形成されます。これは下向きのギャップを作り、しばしばレジスタンスとして機能します。
これらのギャップは、積極的な買いまたは売りが行われたエリアを表しており、市場は元の方向に進む前に「公正価値」を求めて頻繁にこれらの価格の不均衡を再訪します。
緩和タイプの理解
完全緩和(保守的)
- ブルッシュFVG: 価格がギャップの下端を下回ったときに緩和とみなされます
- ベアリッシュFVG: 価格がギャップの上端を上回ったときに緩和とみなされます
- 使用例: ギャップが完全に埋まったことの確認に使用し、スイングトレーダーや確認を求める戦略に適しています
50% 中間点 / CE(バランス型)
- ブルッシュFVG: 価格が中間点に達するかそれを下回ったときに緩和とみなされます
- ベアリッシュFVG: 価格が中間点に達するかそれを上回ったときに緩和とみなされます
- 使用例Consequent Encroachment(CE)レベルは機関投資家が注文を置くことが多く、良好なリスクリワードでのエントリーに理想的です
タッチ緩和(積極的)
- ブルッシュFVG: 価格が上端の境界に触れるかそれを越えたときに緩和とみなされます
- ベアリッシュFVG: 価格が下端の境界に触れるかそれを越えたときに緩和とみなされます
- 使用例FVG境界での反応を捉えたいトレーダー向けの早期警告システムで、スキャルピングや迅速なエントリーに最適です
使い方
基本設定
- チャートに Precision FVG Analysis を追加します
- 好みの ソース時間軸 を設定します:
-
- 「ChartTimeframe」を選択して現在のチャートでFVGを検出
- 「Custom」を選択し、特定の時間軸(例:H4、D1)を選んでより高い時間軸のFVGを表示
- 小さく重要でないギャップを除外するために 最小ギャップサイズ を設定します(推奨:FXの場合2-5ピップス)
緩和設定
- 緩和追跡を有効にするには Show Mitigation をオンにします
- 取引スタイルに基づいて Mitigation Type を選択します:
-
- デイトレーダーやスキャルパー: 「Touch」または「Midpoint50」を検討
- スイングトレーダー: 確認のために「Full」を使用
- 緩和ラインの外観は Line Style と Thickness でカスタマイズ可能
視覚的カスタマイズ
- ボックスの投影距離を制御するために Box Extension を設定(デフォルトは20バー)
- 好みの Label Display を選択
- チャートテーマに合わせて Bullish Color と Bearish Color を調整
- 最適な視認性のために Box Transparency を微調整
取引戦略
戦略1:高時間軸FVGと低時間軸エントリー
- M15またはM5チャートでインジケーターをH4またはD1時間軸に設定
- 緩和されていない高時間軸FVGを特定
- 価格が低時間軸のFVGに近づくのを待つ
- 低時間軸の確認(ローソク足パターン、オーダーブロックなど)を探す
- 選択した緩和レベルに価格が達したらエントリー
戦略2:FVGコンフルエンスゾーン
- 異なる時間軸でインジケーターを複数インスタンス使用
- 複数の時間軸FVGが重なるエリアを特定
- これらのコンフルエンスゾーンは高確率の取引ポイントを提供
- 緩和追跡を使って正確にエントリータイミングを計る
戦略3:ブレイクアウト確認
- 重要なサポート/レジスタンスレベルを特定
- ブレイクアウト時のFVG形成を監視
- ブレイクアウト方向の緩和されていないFVGは継続を示唆
- 緩和されたFVGは失敗したブレイクアウトや反転の可能性を示唆
戦略4:緩和ベースのスキャルピング
- 低時間軸(M1、M5)でタッチ緩和を使用
- FVGに触れたら即エントリー
- 前のスイング高値/安値をターゲットに設定
- FVGの下/上にタイトなストップを使用
技術仕様
- プラットフォーム: cTrader
- タイプ: オーバーレイインジケーター
- 計算: バークローズ時のリアルタイム
- 履歴バー: 初期化時に最大500バーをスキャン
- 最大アクティブFVG数: 同時に500ギャップまで
- リソース使用量: 軽量でパフォーマンス最適化済み
ベストプラクティス
一般的な取引ガイドライン
- 他のコンセプトと組み合わせる: FVGはオーダーブロック、流動性プール、市場構造と組み合わせると最も効果的
- 市場の文脈を尊重する: 高時間軸のFVGは低時間軸よりも重要度が高い
- 複数の時間軸を使用する: 異なる時間軸のFVGを重ねてコンフルエンスを作る
- リスク管理: 適切なストップロスを常に使用し、すべてのFVGが機能するわけではないことを理解する
最適化のヒント
- 最小ギャップサイズを調整: 使用する銘柄の平均ボラティリティに基づいて設定
- ボックス延長: スイングトレードには長め(50-100バー)、デイトレードには短め(10-20バー)を推奨
- 緩和タイプ: 取引の時間軸とスタイルに合わせて選択
- ラベル距離: チャートの混雑度やズームレベルに応じて調整
避けるべき一般的な落とし穴
- 過剰取引: すべてのFVGが取引機会ではない
- 文脈の無視: 強いトレンドに逆らうFVGは信頼性が低い
- 誤った緩和タイプの使用: スキャルパーが完全緩和を使うとエントリーを逃し、スイングトレーダーがタッチを使うとストップにかかりやすい
- 確認なしの取引: FVGレベルでのプライスアクションの確認を常に待つこと
よくある質問
Q: なぜ一部のFVGはすぐに消えるのですか? A: 「Show Mitigation」が「Touch」緩和で有効になっている場合、すぐに戻されたFVGはすぐに点線に変わります。これは正常な動作です。
Q: 複数の時間軸のFVGを同時に見ることはできますか? A: はい!異なるカスタム時間軸でインジケーターを複数回チャートに追加してマルチタイムフレーム分析が可能です。
Q: 他のFVGインジケーターと何が違いますか? A: Precision FVG Analysisはマルチタイムフレーム対応、3つの緩和タイプ、状態に基づく視覚的明瞭さ(ボックスとラインの切り替え)を提供します。
Q: どの緩和タイプを使うべきですか? A: 早期シグナルと信頼性のバランスを取るためにMidpoint50(CE)から始めて、結果や取引スタイルに応じて調整してください。
Q: すべての銘柄で使えますか? A: はい、このインジケーターはFX、指数、商品、暗号通貨で動作します。銘柄のボラティリティに応じて「最小ギャップサイズ」パラメーターを調整してください。
Q: 履歴スキャンはどのくらい遡りますか? A: インジケーターは初期化時に最大500バーをスキャンし、包括的な履歴コンテキストを提供します。
サポートとアップデート
このインジケーターは積極的にメンテナンスおよび更新されています。ユーザーは以下を受け取ります:
- 新機能を含む定期的なアップデート
- パフォーマンスの最適化
- バグ修正と改善
- ドキュメントの更新
質問、提案、サポートについては、cTraderストアのメッセージシステムを通じてお問い合わせください。
免責事項
取引には大きな損失リスクが伴い、すべての投資家に適しているわけではありません。過去のパフォーマンスは将来の結果を保証するものではありません。このインジケーターは分析ツールであり、金融アドバイスを構成するものではありません。常に適切なリスク管理を行い、失ってもよい以上のリスクを負わないでください。
バージョン履歴
バージョン 1.0(現在)
- マルチタイムフレームFVG検出
- 三つの緩和タイプ(完全、50%中間点、タッチ)
- 視覚的状態変化(ボックスから点線へ)
- カスタマイズ可能な色と透明度
- 柔軟なラベリングシステム
- 履歴スキャン(500バー)
- リアルタイム検出と追跡
Precision FVG Analysis - あなたのフェアバリューギャップ取引をプロフェッショナルレベルに引き上げます。
5 | 100 % | |
4 | 0 % | |
3 | 0 % | |
2 | 0 % | |
1 | 0 % |


