Penerangan
🚀 Volume Profile Pro untuk cTrader
Buka struktur sebenar di sebalik tindakan harga dengan Volume Profile Pro, penunjuk Volume-by-Price yang kuat dan boleh disesuaikan sepenuhnya yang direka khusus untuk pedagang profesional cTrader.
Alat canggih ini memvisualisasikan profil volum individu bagi setiap tempoh jangka masa yang dipilih, membolehkan anda melihat dengan tepat di mana aktiviti institusi tertumpu — terus di dalam carta anda.
🔎 Apa Yang Dilakukannya
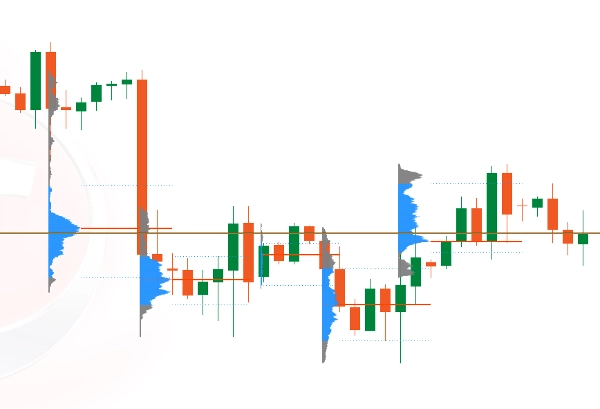
Volume Profile Pro mengira dan memaparkan pengagihan volum julat tetap untuk setiap tempoh yang lengkap (H1, M15, D1, dll.), dipetakan terus pada paksi harga untuk analisis struktur yang tepat.
Setiap profil:
- Dilukis secara individu bagi setiap tempoh
- Menggunakan julat harga tetap yang konsisten
- Memaparkan pengagihan volum mengikut tahap harga
- Menonjolkan tahap institusi utama
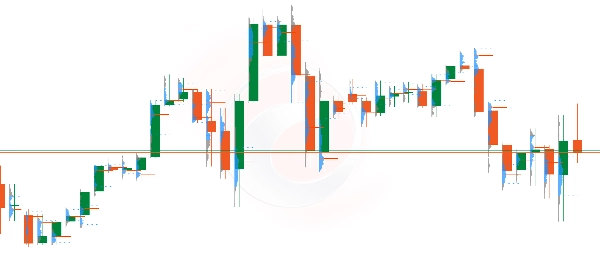
Profil diposisikan dengan kemas di kiri setiap lilin, memastikan pengenalan struktur yang jelas tanpa menghalang tindakan harga.
⚡ Ciri Utama
✔ Profil volum individu bagi setiap tempoh jangka masa
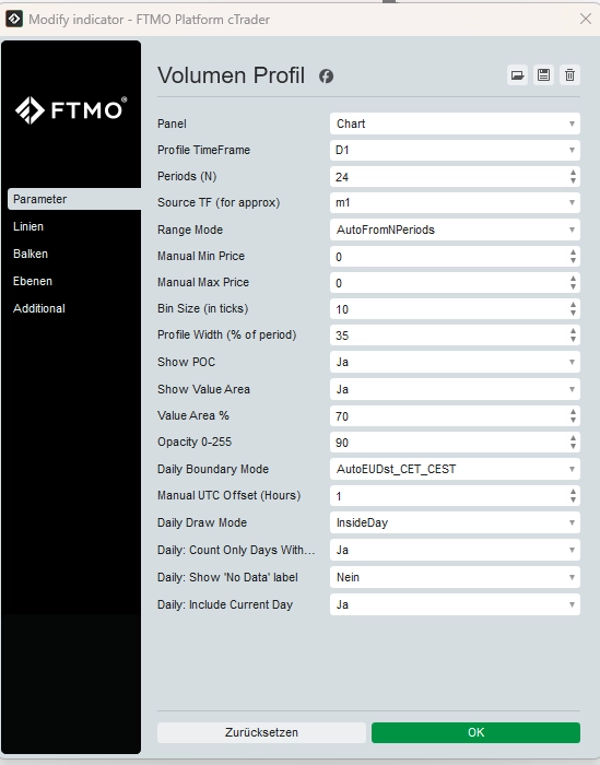
✔ Tempoh jangka masa profil boleh dipilih (M15, H1, H4, D1, dll.)
✔ Julat harga tetap (automatik atau manual)
✔ Penonjolan Titik Kawalan (POC)
✔ Kawasan Nilai Tinggi (VAH) & Kawasan Nilai Rendah (VAL)
✔ Rendering lancar tanpa berkelip carta
✔ Dioptimumkan sepenuhnya untuk prestasi
✔ Direka untuk persekitaran CFD dan Volum Tick
📊 Mengapa Pedagang Menggunakannya
- Kenal pasti zon pengumpulan & pengagihan institusi
- Kenal pasti tahap reaksi berkemungkinan tinggi
- Sahkan kekuatan pecahan
- Perhalusi kemasukan dalam julat konsolidasi
- Selaraskan struktur volum dengan tindakan harga
Sama ada anda seorang scalper, pedagang intraday, atau pedagang swing, Volume Profile Pro memberi anda kelebihan struktur.
⚠ Penafian Penting
Volume Profile adalah alat perisian perdagangan dan tidak merupakan nasihat kewangan atau pelaburan.
Perdagangan Forex, CFD, dan instrumen kewangan lain melibatkan risiko besar dan mungkin mengakibatkan kehilangan modal.
🎯 Dibina untuk Ketepatan. Direka untuk Profesional.
Bawa analisis struktur pasaran anda ke tahap seterusnya dan berdagang dengan kejelasan, keyakinan, dan kawalan.
Ringkasan
Ulasan pelanggan
5 | 100 % | |
4 | 0 % | |
3 | 0 % | |
2 | 0 % | |
1 | 0 % |