
Penerangan
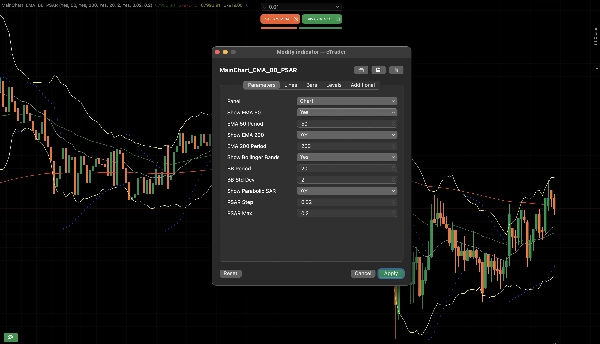
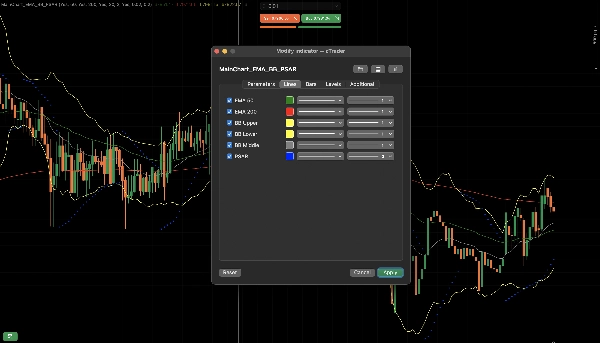
MainChart_EMA_BB_PSAR
Bagaimana Ia Berfungsi
1. Konsep Teras
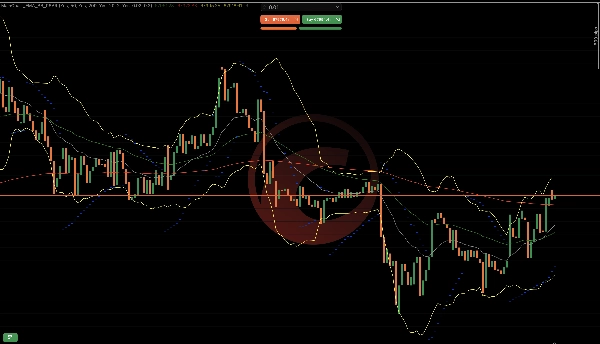
Penunjuk ini menggabungkan logik kesinambungan trend, volatiliti, dan momentum ke dalam satu lapisan:
EMA 50 & EMA 200 → Arah trend
Bollinger Bands → Volatiliti & pengembangan
Parabolic SAR → Kesinambungan trend & masa pembalikan
Setiap komponen mempunyai fungsi tertentu. Bersama-sama, mereka membentuk rangka kerja keputusan yang tersusun.
2. Logik EMA (Enjin Trend)
Apa Yang Dilakukan
Mengira purata eksponen harga penutupan.
EMA 50 bertindak balas lebih pantas.
EMA 200 bertindak balas lebih perlahan.
Bagaimana Ia Mentafsir Pasaran
Maksud Keadaan
EMA 50 di atas EMA 200 Trend menaik
EMA 50 di bawah EMA 200 Trend menurun
EMA 50 melintasi EMA 200 Kemungkinan perubahan trend
Mengapa Ia Berfungsi
EMA melicinkan harga dan menapis bunyi.
Hubungan 50/200 menunjukkan momentum jangka pendek berbanding arah jangka panjang.
3. Logik Bollinger Bands (Enjin Volatiliti)
Apa Yang Dilakukan
Mengira purata bergerak (jalur tengah)
Membina jalur atas/bawah menggunakan sisihan piawai
Bagaimana Ia Mentafsir Pasaran
Maksud Keadaan
Jalur mengecil Volatiliti rendah (pemampatan)
Jalur mengembang Volatiliti tinggi (pergerakan kuat aktif)
Harga menyentuh jalur luar Potensi keterlaluan
Mengapa Ia Berfungsi
Pasaran berayun antara pemampatan dan pengembangan.
Pecahan sering berlaku selepas pengecutan volatiliti.
4. Logik Parabolic SAR (Enjin Kesinambungan)
Apa Yang Dilakukan
Melakar titik di atas atau di bawah harga.
Mempercepatkan apabila trend berterusan.
Bagaimana Ia Mentafsir Pasaran
Maksud Kedudukan Titik
Di bawah harga Trend menaik aktif
Di atas harga Trend menurun aktif
Titik berbalik Kemungkinan pembalikan
Mengapa Ia Berfungsi
PSAR mengecil apabila trend matang, membantu menjejaki pergerakan dan mengesan keletihan.
5. Bagaimana Semua Komponen Bekerjasama
Struktur Menaik
EMA 50 di atas EMA 200
Harga di atas EMA 50
PSAR di bawah lilin
Bollinger Bands mengembang ke atas
→ Menunjukkan momentum menaik yang kuat
Struktur Menurun
EMA 50 di bawah EMA 200
Harga di bawah EMA 50
PSAR di atas lilin
Bollinger Bands mengembang ke bawah
→ Menunjukkan momentum menurun yang kuat
6. Pengesanan Fasa Pasaran
Penunjuk ini membantu mengenal pasti 3 fasa pasaran:
Fasa Tren
EMA selaras
PSAR konsisten
Jalur mengembang
Terbaik untuk perdagangan kesinambungan.
Fasa Pemampatan
Jalur ketat
EMA rata
PSAR kerap berbalik
Terbaik menunggu pecahan.
Fasa Peralihan
Persilangan EMA terbentuk
PSAR berbalik
Jalur melebar
Potensi pembalikan awal.
7. Contoh Aliran Praktikal
Contoh urutan menaik:
Jalur mengecil
Lilin menaik kuat memecah jalur atas
EMA 50 melintasi di atas EMA 200
PSAR berbalik di bawah harga
Urutan ini menunjukkan:
Pengembangan volatiliti
Pengesahan trend
Sokongan kesinambungan
8. Apa Yang Tidak Dilakukan
Tidak meramalkan berita
Tidak menjamin pembalikan
Tidak mengukur aliran pesanan
Tidak menghapuskan pecahan palsu
Ia menyediakan pengesahan tersusun, bukan kepastian.
9. Model Logik Ringkasan
Penapis Trend → EMA
Pencetus Volatiliti → Bollinger Bands
Masa & Jejak → Parabolic SAR
Bersama-sama, mereka mengurangkan kemasukan rawak dan meningkatkan pembuatan keputusan yang tersusun.
Kebaikan penunjuk ini adalah boleh dikonfigurasikan dan Tidak perlu menyediakan pelbagai penunjuk.
Ringkasan
1. Exponential Moving Averages (EMA 50 and EMA 200) to determine trend direction—EMA 50 reacts faster to price changes, while EMA 200 provides a longer-term trend perspective. The relative position of these EMAs signals bullish or bearish trends and potential trend shifts.
2. Bollinger Bands to measure market volatility and detect phases of compression (low volatility) and expansion (high volatility). Narrow bands indicate potential breakout setups, while price touching outer bands suggests possible overextension.
3. Parabolic SAR to identify trend continuation and reversal timing by plotting dots above or below price, signaling active uptrends or downtrends and potential reversals when dots flip position.
Together, these components form a structured decision framework that helps identify market phases—trending, compression, and transition—and supports confirmation of trend strength and momentum. The indicator is configurable and designed to reduce random entries by combining trend filtering, volatility triggers, and timing signals. It is applicable across various markets including Forex, cryptocurrencies, stocks, commodities, and indices. This tool provides structured confirmation for trading decisions but does not predict news events, guarantee reversals, or eliminate false breakouts.
Ulasan pelanggan
5 | 50 % | |
4 | 50 % | |
3 | 0 % | |
2 | 0 % | |
1 | 0 % |


![Logo "Smart Money Concepts (SMC) [Iridio Capital]"](https://cdn.ctrader.com/image/webp/28b69fd1-ef54-4bed-9487-07e78e883be4_40934)


