
Açıklama
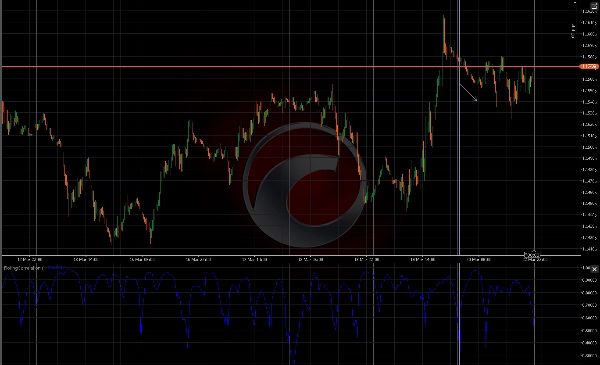
RollingCorrelation, her kapanış fiyatı ile 1-bar gecikmeli fiyatı arasındaki kayan Pearson korelasyonunu yapılandırılabilir bir pencere üzerinde hesaplar. Gösterge, değerleri [-1, 1] aralığında döndürür; +1'e yakın değerler güçlü pozitif otokorelasyonu (trend devamı), -1'e yakın değerler güçlü negatif otokorelasyonu (osilatör veya dönüş davranışı) ve 0'a yakın değerler ise az veya hiç doğrusal otokorelasyon olmadığını gösterir.
Nasıl çalışır Her bar için, kapanış fiyatları serisi ile aynı serinin bir bar kaydırılmış hali arasında belirtilen Periyot penceresi (varsayılan 20) boyunca Pearson korelasyon katsayısını hesaplar. Uygulama, her bar için tek bir korelasyon değeri üretmek üzere standart kovaryans / varyans formülünü kullanır.
Girdiler
- Periyot (int, varsayılan 20): kayan pencere içindeki bar sayısı. Gösterge, ilk değeri hesaplamak için en az Periyot+1 bar gerektirir.
Çıktı
- Korelasyon (çizgi): her bar için kayan korelasyon değeri, aralık [-1, 1].
Yorumlama ve pratik kullanım
- +1'e yakın: fiyat güçlü süreklilik gösterir — son hareketlerin devam etme olasılığı yüksek (trend takip sinyalleri için faydalı).
- -1'e yakın: güçlü negatif otokorelasyon — fiyat genellikle bir bardan diğerine tersine döner (ortalama dönüş taktikleri için faydalı).
- 0'a yakın: lag 1'de tutarlı doğrusal ilişki yok — fiyat hareketi pencere boyunca rastgele görünür.
- Tipik sinyal desenleri: eşik geçişleri (örneğin, >0.6 veya <−0.6), korelasyonda sürekli artış/azalışlar, fiyat ile korelasyon arasında uyumsuzluk veya diğer sistemlerden girişlerin filtrelenmesi (trend girişleri için korelasyon > 0.5 veya dönüş kurulumları için < −0.5 gerektirir).
Ticaret fikirleri
- Düşük volatilite gürültüsü sırasında sinyallerden kaçınmak için volatilite filtreleri (ATR) ile birleştirin.
- Korelasyon pozitif olduğunda yönü doğrulamak için trend göstergeleri (hareketli ortalamalar, MACD) ile birlikte kullanın.
- Korelasyon güçlü negatif ve fiyat destek/direnç seviyesinde veya aşırı Bollinger bandında olduğunda kısa vadeli ortalama dönüş tetikleyicisi olarak kullanın.
- Kısa zaman dilimleri (örneğin, M1–M15) ve daha kısa periyotlar scalping için; daha uzun periyotlar/zaman dilimleri swing onayı için kullanılabilir.
Önerilen ayarlar
- Varsayılan Periyot = 20 başlangıç noktası olarak iyi çalışır.
- Kısa vadeli: Periyot 8–14 (scalping / gün içi).
- Orta vadeli: Periyot 20–50 (swing / trend onayı).
- Çok gürültülü sembollerde Periyot'u çok büyük veya çok yavaş hareket eden enstrümanlarda çok küçük ayarlamaktan kaçının.
Sınırlamalar ve notlar
- Değerleri hesaplamak için en az Periyot+1 bar gerektirir.
- Pencere içindeki fiyat varyansı sıfırsa (düz fiyatlar), korelasyon paydası sıfır olabilir — bu NaN/tanımsız sonuçlara yol açabilir. Mantıklı Periyot değerleri kullanın ve enstrümanın yeterli fiyat hareketine sahip olduğundan emin olun.
- Bu gösterge yalnızca doğrusal lag-1 korelasyonunu ölçer; doğrusal olmayan ilişkileri veya çoklu bar gecikmelerini tespit etmez.
- Bağımsız bir ticaret sistemi değildir — en iyi şekilde bir stratejide filtre veya onay aracı olarak kullanılır.
Galeriye dahil edilmesi önerilen örnekler
- Trend aşamasında güçlü korelasyon gösteren Period=20 ile EURUSD H1.
- Osilatör davranışı ve negatif korelasyon dönemleri gösteren BTCUSD 1H.
- Kısa Periyot ile scalping kullanımını gösteren XAUUSD 15m.
Özet
For each bar, the indicator computes the Pearson correlation coefficient between the series of close prices and the same series shifted by one bar within the specified period. This calculation uses standard covariance and variance formulas to generate a single correlation value per bar.
Traders can use this indicator to identify trend strength or potential reversals, applying threshold crossings or sustained changes in correlation as signals. It is useful for trend-following strategies when correlation is positive and for mean-reversion tactics when correlation is negative. The indicator can be combined with volatility filters and other trend indicators for confirmation. It supports various markets including Forex, stocks, indices, commodities, and cryptocurrencies, and is applicable across multiple timeframes from scalping (M1–M15) to swing trading.
The indicator requires at least Period+1 bars to compute values and is intended as a supplementary tool rather than a standalone trading system.


!["[Stellar Strategies] Market Session Ultimate" logosu](https://cdn.ctrader.com/image/webp/61ffd537-0125-4246-9e72-42eca1791d64_28232)


