
Penerangan
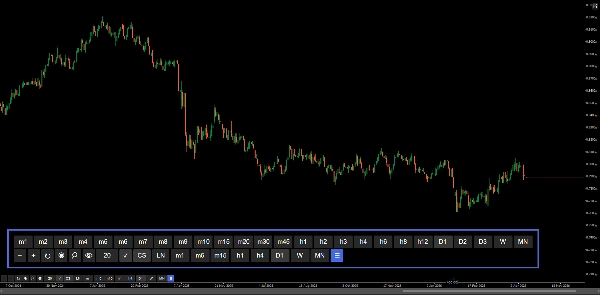
Panel kawalan carta untuk navigasi lebih pantas — zum, jangka masa, dan tetapan carta tanpa meninggalkan carta.
Pratetapan zum, kemasukan zum manual, pemilih jangka masa penuh dan carta, jangka masa kegemaran yang boleh dikonfigurasikan, pemisah tempoh, grid nombor bulat, dan garis bida/tanya langsung — semua boleh diakses melalui butang UI pada carta. Direka untuk mengurangkan masa yang dihabiskan untuk menavigasi menu asli cTrader semasa sesi dagangan aktif.
CIRI-CIRI
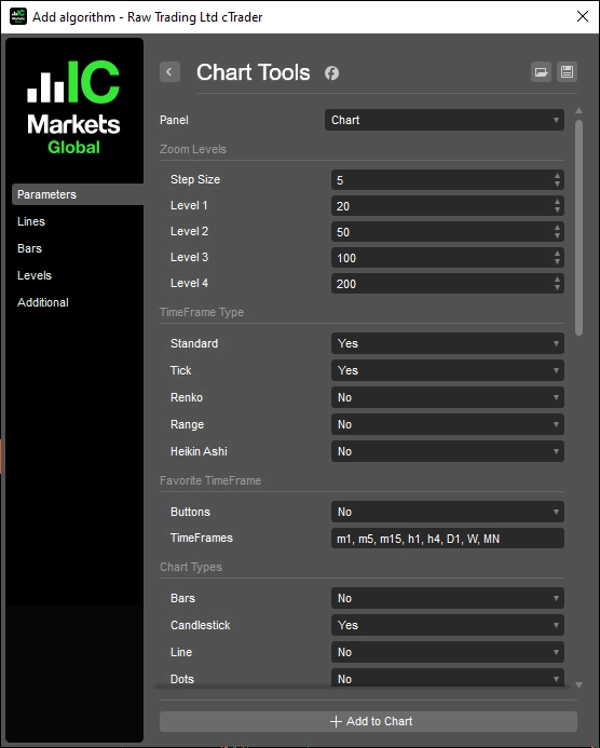
Kawalan Zum
- Zum masuk / zum keluar dengan saiz langkah yang boleh dikonfigurasikan
- Empat tahap zum pratetap yang boleh dikonfigurasikan untuk akses satu klik
- Kemasukan zum manual dengan butang guna
- Diselaraskan dengan acara zum asli cTrader
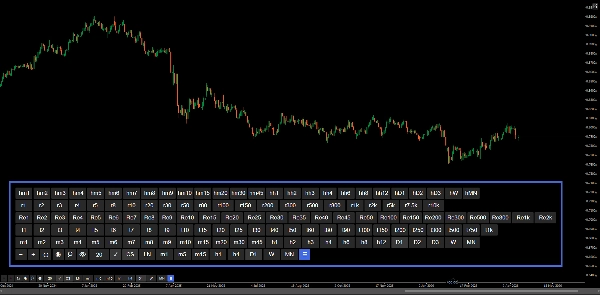
Pemilih Jangka Masa
- Panel butang penuh merangkumi semua jenis jangka masa: Standard, Heikin Ashi, Renko, Range, Tick
- Mod Semua memaparkan setiap jenis sebagai baris berasingan
- Jangka masa aktif diserlahkan secara automatik
- Togol keterlihatan panel dengan butang ☰
Jangka Masa Kegemaran
- Baris akses pantas yang boleh dikonfigurasikan melalui input dipisahkan koma (contoh: m1, h1, D1)
- Menyokong semua jenis jangka masa termasuk Range dan Tick
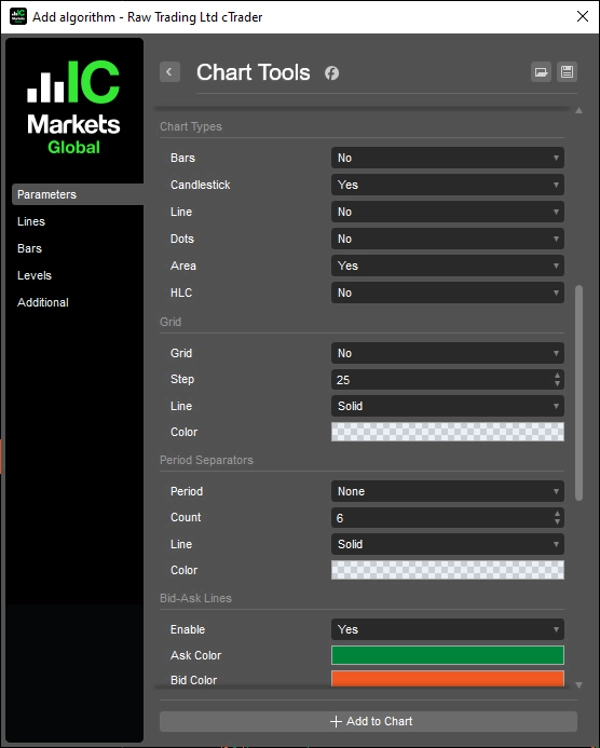
Jenis Carta
- Butang tukar cepat untuk: Bar, Lilin, Garis, Titik, Kawasan, HLC
- Jenis carta aktif diserlahkan secara automatik
- Setiap butang boleh dikonfigurasikan secara individu melalui parameter
Grid
- Grid berasaskan nombor bulat dengan selang pip yang boleh dikonfigurasikan (Pengganda)
- Label harga dengan format perpuluhan pintar
- Garis memanjang 10 bar melebihi bar terakhir
- Togol hidup/mati
Pemisah Tempoh
- Pemisah Harian, Mingguan, Bulanan, dan Tahunan
- Kiraan, warna, gaya garis, dan ketebalan yang boleh dikonfigurasikan
- Kemas kini automatik semasa skrol dan zum
Garis Bida/Tanya
- Garis bida dan tanya langsung yang memanjang tanpa had
- Warna boleh dikonfigurasikan untuk tanya dan bida
- Togol hidup/mati
Butang
- Posisi: Kanan Atas, Kiri Atas, Kanan Bawah, Kiri Bawah
- Margin boleh dikonfigurasikan
- Warna butang dan warna teks boleh dikonfigurasikan — termasuk keadaan aktif, guna zum, dan butang togol carta
__________________________________________________________________________________________
LAGI PENUNJUK PERCUMA
Terokai pelbagai alat analisis pasaran—daripada struktur dan volum kepada regresi, volatiliti, dan jangka masa tersuai.
Kod sumber tersedia di repositori GitHub.
Semua percuma untuk digunakan. Tetapi jika anda ingin menyokong dengan kopi, anda boleh salurkan ia di sini.
Sokongan/Perlawanan
Volum
- Profiler Aktiviti Volum
- Penganalisis Kecekapan Volum
- Analitik Profil Volum
- Profil Volum - Dikemas Kini
- Analisis Sebaran Volum
- VWAP (Harga Purata Berwajaran Volum)
Purata Pergerakan
- Saluran SSL
- Purata Pergerakan Berangkai
- Purata Pergerakan Skala Sisihan
- Pengaktif Tinggi Rendah Gann
- Garis Tren Segera
- Purata Pergerakan Adaptif Kaufman dengan Visi Tren
- Saluran Purata Pergerakan
- Set Purata Pergerakan
- Purata Pergerakan Saluran Tren
Utiliti/Tersuai
Berasaskan Regresi
Volatiliti
Osilator
__________________________________________________________________________________________
PENAFIAN
Perdagangan melibatkan risiko. Penunjuk ini bertujuan untuk analisis teknikal sahaja — sentiasa gunakan pengurusan risiko yang betul dan berdagang dengan bertanggungjawab.
MAKLUMBALAS & PENAMBAHBAIKAN
Jika anda mempunyai cadangan, permintaan ciri, atau idea untuk penambahbaikan, sila tinggalkan komen di tab Perbincangan. Maklum balas anda membantu meningkatkan penunjuk untuk semua orang.
Ringkasan
Users can configure a quick-access row of favorite timeframes supporting all timeframe types. The chart type switcher offers quick buttons for Bars, Candlestick, Line, Dots, Area, and HLC charts, each with individual configuration and automatic active state highlighting.
Additional features include a round numbers-based grid with configurable pip intervals and smart decimal formatting, daily to yearly period separators with customizable appearance, and live bid/ask lines extending indefinitely with color customization and toggle options.
The control panel’s buttons can be positioned in any corner of the chart with configurable margins and colors, including active states and zoom application. This tool aims to streamline active trading sessions by reducing time spent navigating native menus, supporting efficient technical analysis on various chart types and timeframes.
Ulasan pelanggan
5 | 100 % | |
4 | 0 % | |
3 | 0 % | |
2 | 0 % | |
1 | 0 % |


![Logo "[Hamster-Coder] Bollinger Bands"](https://cdn.ctrader.com/image/webp/21d8e5d6-fb11-4bac-b9ee-cd05c2b76804_30327)


