Descrizione
IR Open Connector
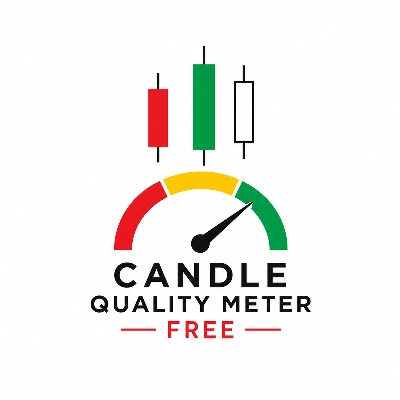
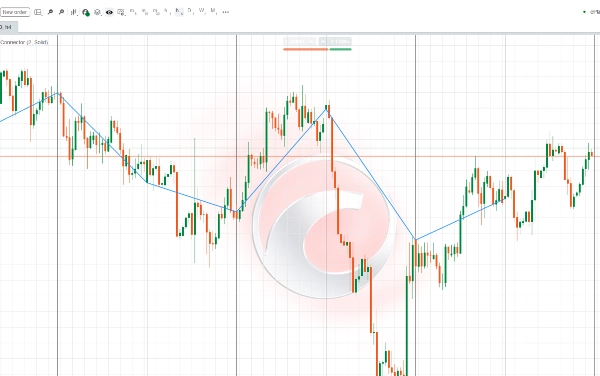
Questo indicatore è progettato per collegare i prezzi di apertura delle candele di timeframe superiori, a seconda del timeframe attuale del grafico:
- Se il timeframe è inferiore a un'ora → collega le aperture delle candele giornaliere.
- Se il timeframe è di 4 ore → collega le aperture delle candele settimanali.
- Se il timeframe è superiore a 4 ore ma inferiore a settimanale → collega le aperture delle candele mensili.
Questo permette ai trader di visualizzare chiaramente i livelli chiave di apertura di periodi superiori (giornalieri, settimanali, mensili) direttamente sui loro grafici. Questi livelli spesso fungono da aree critiche di supporto e resistenza, potenziali zone di inizio trend e importanti punti di riferimento nell'analisi di mercato.
Il colore, lo spessore e lo stile della linea sono completamente personalizzabili, offrendoti la flessibilità di adattare la visualizzazione al tuo stile di trading personale.
این اندیکاتور طراحی شده تا نقاط باز شدن کندلهای تایمفریمهای بالاتر را بسته به تایمفریم فعلی شما به هم متصل کند:
- اگر تایمفریم کمتر از یک ساعت باشد → باز شدن کندلهای روزانه را به هم وصل میکند.
- اگر تایمفریم چهارساعته باشد → باز شدن کندلهای هفتگی را به هم وصل میکند.
- اگر تایمفریم بزرگتر از چهارساعته و کوچکتر از هفتگی باشد → باز شدن کندلهای ماهانه را به هم وصل میکند.
این ویژگی به معاملهگر کمک میکند تا به سادگی سطوح مهم شروع دورههای بزرگتر (روزانه، هفتگی، ماهانه) را روی نمودار مشاهده کند. این سطوح اغلب بهعنوان نقاط کلیدی حمایت و مقاومت، شروع روندهای جدید یا محدودههای معاملاتی مهم در نظر گرفته میشوند.
با تنظیم رنگ، ضخامت و نوع خط، میتوانید نمایش این خطوط را مطابق با سبک معاملاتی خود شخصیسازی کنید.