present
Registrati e ricevi uno sconto da $50 sul tuo primo acquisto
Trading product for Sync Lines Indicatore Key Levels Support & Resistance, image 1
Sync Lines
Indicatore
Versione 1.0, May 2026
Windows, Mac
Trading product for Sync Lines Indicatore Key Levels Support & Resistance, image 2
Trading product for Sync Lines Indicatore Key Levels Support & Resistance, image 3
Da 06/04/2026

Descrizione

Professional Multi-Chart Level Synchronization Tool for cTrader

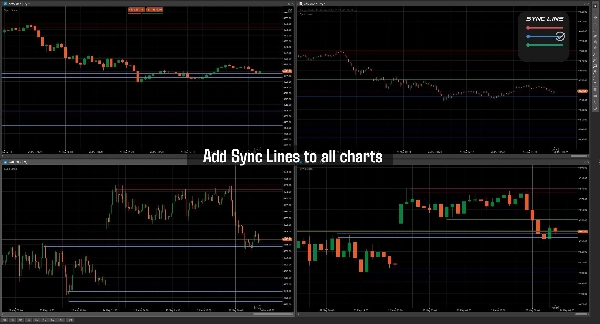
Sync Horizontal Lines is a professional charting utility built for traders who rely heavily on support/resistance zones, liquidity areas, market structure, and multi-timeframe analysis inside cTrader. The indicator allows traders to draw horizontal price levels once and automatically synchronize them across all charts of the same symbol instantly.

Unlike traditional manual chart marking, Sync Horizontal Lines removes repetitive work by keeping levels aligned between different timeframes and chart layouts. Whether you are analyzing M1, M15, H1, or Daily charts, your important levels remain fully synchronized and visually consistent.

The indicator includes a fast hotkey-based workflow for creating, deleting, and color-cycling lines directly from the chart without opening settings panels or menus. Traders can organize support, resistance, liquidity zones, entries, stop losses, take profits, session highs/lows, or custom execution levels using multiple line colors.

A built-in persistent storage system automatically saves all lines locally, ensuring that your levels remain available even after restarting cTrader. Each symbol maintains its own independent synchronized levels, preventing chart clutter between instruments.

Designed for speed and efficiency, Sync Horizontal Lines is lightweight, responsive, and suitable for scalpers, day traders, swing traders, ICT traders, SMC traders, prop firm traders, and multi-monitor trading setups.

Main Features

  • Real-time synchronized horizontal levels across charts
  • Same-symbol multi-timeframe synchronization
  • Automatic local save/load persistence
  • Fast keyboard + mouse workflow
  • Multiple line color management
  • Lightweight and low resource usage
  • Instant level updating across charts
  • No manual re-drawing required
  • Professional workflow optimization


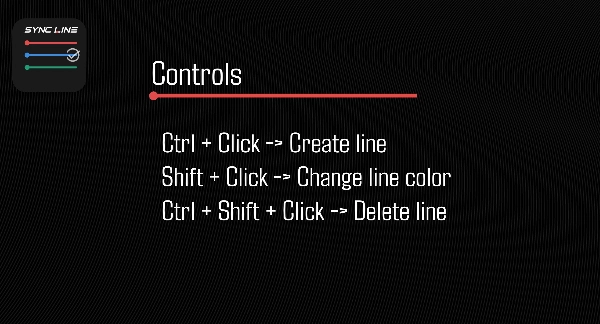
Controls

  • Ctrl + Click → Create line
  • Shift + Click → Change line color
  • Ctrl + Shift + Click → Delete line


Ideal For

  • Support & Resistance traders
  • ICT and SMC strategies
  • Scalping workflows
  • Intraday trading
  • Liquidity mapping
  • Session range marking
  • Multi-monitor setups
  • Professional chart management


Installation

Simply add the indicator to your Multicharts of different timeframe and start drawing using the keyboard shortcuts. No setup required.

The Indicator must be added to different charts to work properly.

Riepilogo

Profilo indicatore
Categoria indicatore
Supporto e resistenza
Tipo di output
Visualizzazione
Requisiti per i dati
Solo barre

Discussioni

Recensioni dei clienti

0.0
Recensioni: 0
Recensioni dei clienti
Questo prodotto non ha ancora ricevuto recensioni. L'hai già provato? Fallo sapere agli altri per primo!

Domande frequenti

Key Levels
Support & Resistance
I prodotti disponibili tramite cTrader Store, inclusi bot di trading, indicatori e plugin, sono forniti da sviluppatori terzi e resi disponibili esclusivamente a scopo informativo e di accesso tecnico. cTrader Store non è un broker e non fornisce consulenze in materia di investimento, raccomandazioni individualizzate o garanzie di risultati futuri.

Potrebbe interessarti anche

Indicatore
Drawdown Monitor
Protect your funded account. Real-time Daily Equity Drawdown monitor with Green / Orange / Red flashing alerts.
Indicatore
Fair Value Gap
Liquidity Grab
+2
PRO Liquidity Sweep + FVG Combo detector with custom Gold/Blue signals & alerts
Indicatore
Breakout
Allow trader to visualize Support & Resistance across different timeframes,give trader an overview of the current market
Indicatore
ATR
BOS
+3
Fair Value Gaps with Multi-Timeframe.
Indicatore
Forex
NAS100
+3
volumen perfile
Indicatore
AI
Grid
+17
Clean 3D, Sleek Candles for Trend Patterns.
Indicatore
Key Levels
Trend-filtered signals, transparent trade plans and a multi-timeframe decision panel for cTrader.
Indicatore
Forex
BTCUSD
+11
📈 Adaptive ALMA-Gaussian hybrid trend filter with precision smoothing and clear buy/sell signals.
Indicatore
ATR
Key Levels
+1
Explore 88 harmonic price-pattern variants with interactive chart controls and geometric reference levels.
Indicatore
Breakout
Open Range Breakout by SLA is a fully customizable multi-session indicator designed for structured intraday traders.
Indicatore
Volume
Support & Resistance
Compare up to 27 symbols across eight timeframes with seven analysis engines and an interactive cTrader dashboard.
Indicatore
VWAP
Volume
+4
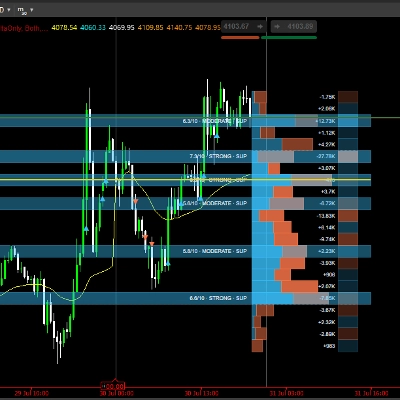
Advanced Order Flow & Volume Profiling for cTrader. Unveil institutional footprints, Delta, and Anchored VWAPs.
Indicatore
EMA
RSI
+5
MACD Colour Histogram with 11 Moving Average Types, Multi-timeframe confirmation and Sound Signal Alert.
Indicatore
Prop
Forex
+13
🐠 Coral Filter X Pro turns trend detection into a simple, repeatable workflow 🐠
Indicatore
ATR
RSI
+6
🔍 MultiScalpScorePRO – Powerful real-time scoring system combining indicators for ultra-precise scalping signals.
Indicatore
ATR
RSI
+2
This indicator works best as a trend-confirmation tool—wait for multiple signals!
Indicatore
Forex
Crypto
+4
Statistical boundaries that adapt to real-time volatility for a better risk management.
Indicatore
RSI
Signal
+3
The Wyckoff Toolkit is the ultimate ally for traders seeking to decode the market through the lens of "smart money."

Prezzo

Da 06/04/2026