

설명
Manual Backtest Helper는 cTrader 플러그인 으로, 스프레드시트, 외부 도구, 데이터 내보내기 없이 차트에서 직접 전략을 기록, 점수 매기기 및 분석할 수 있습니다.
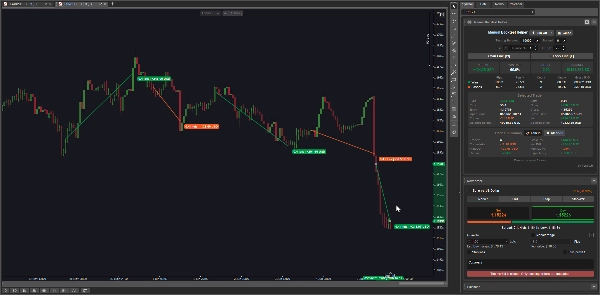
거래를 시각적으로 그리면 플러그인이 즉시 승률, 수익률, 순 손익, 최대 낙폭, 기대값 등을 계산합니다. 거래를 추가하거나 편집할 때마다 모든 것이 실시간으로 업데이트됩니다.
다음 사용자들을 위해 제작되었습니다:
- 재량적 트레이더 — 과거 가격 데이터에서 전략을 수동으로 백테스트하려는 분들
- 개발 중인 트레이더 — 실거래 전에 자신의 설정 기록을 쌓는 분들
- 전략 리뷰어 — 과거 거래를 재생하고 객관적으로 우위를 측정하려는 분들
- 다음 질문에 답하고 싶은 모든 분들: “내 전략이 실제로 우위가 있나요?”
--------------- 주의: 이 플러그인은 현재 macOS에서 잘 작동하지 않습니다 ---------------
주요 기능
📊 두 가지 기록 모드
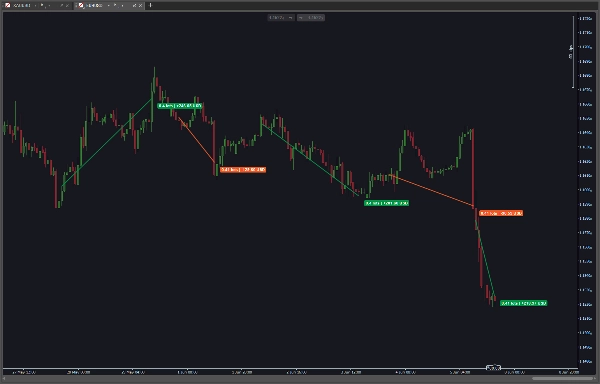
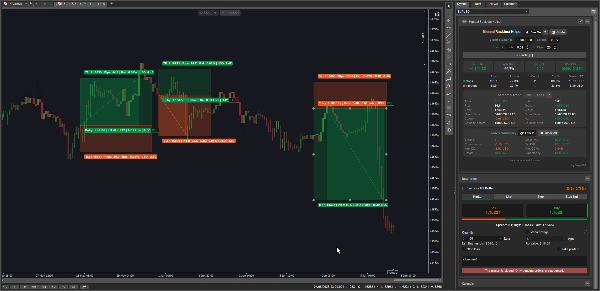
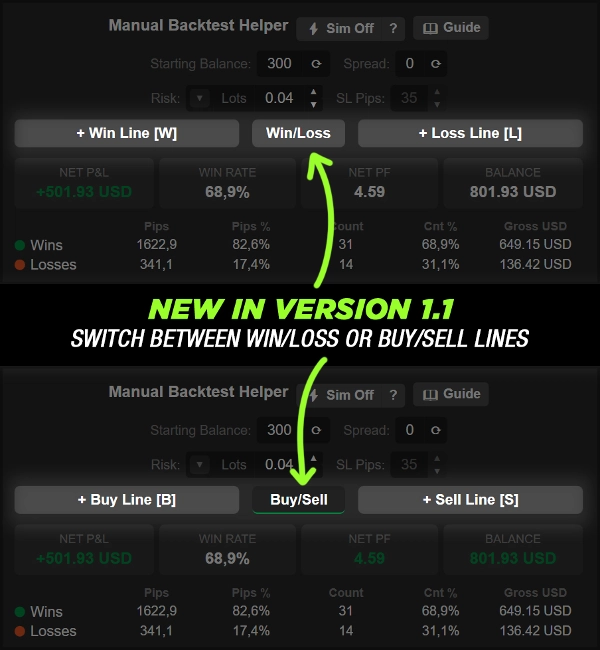
- 수동 모드 — 두 가격 지점 사이에 단순한 추세선으로 승리 또는 패배를 그립니다. 방향(BUY/SELL)은 선의 각도에서 자동으로 추론됩니다
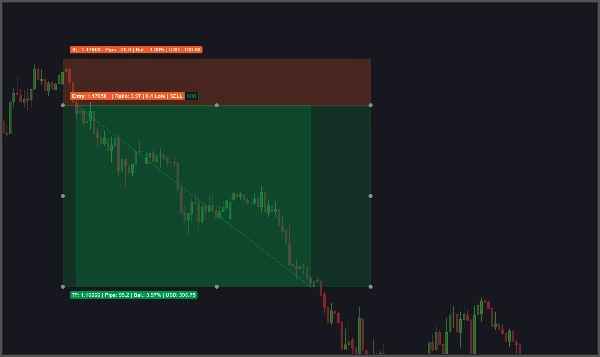
- 시뮬레이션 모드 (⚡) — 진입, 이익 실현 목표, 손절매가 포함된 전체 거래 설정을 클릭하여 배치합니다. 플러그인은 캔들을 앞으로 스캔하여 결과를 승리 또는 패배로 자동 결정합니다
🎯 자동 거래 결과 결정 (시뮬레이션 모드)
- 캔들 하나하나를 스캔하여 목표가 또는 손절매가 먼저 도달했는지 판단합니다
- 두 레벨이 같은 캔들에서 터치될 경우 거래를 모호함으로 표시합니다
- 모호한 거래는 검사기에서 직접 승리나 패배로 수동으로 변경할 수 있습니다
💰 세 가지 위험 모드
- 고정 랏 — 특정 랏 크기를 직접 입력
- 잔고 % — 시작 잔고의 백분율을 위험으로 설정; 랏 크기는 SL 핍에서 자동 계산
- 화폐 금액 — 고정된 통화 금액을 위험으로 설정; 랏 크기는 SL 핍에서 자동 계산
📐 랏 크기 계산 엔진
- 위험 금액과 SL 핍으로부터 올바른 랏 크기를 자동 역산합니다
- 심볼의 최소 거래량 단계에 맞춰 조정합니다
- 심볼의 최소 및 최대 허용 거래량 범위 내로 제한합니다
🔢 구성 가능한 입력값
- 시작 잔고 — 수동 입력 또는 라이브 계정에서 한 번의 클릭으로 동기화
- 스프레드 — 수동 입력 또는 라이브 차트 심볼에서 한 번의 클릭으로 복사
- SL 핍 — 랏 크기 계산과 시뮬레이션 거래 그리기에 사용되는 손절 거리
- 간편한 ▲ / ▼ 스피너 버튼 으로 빠른 증감 조절 가능
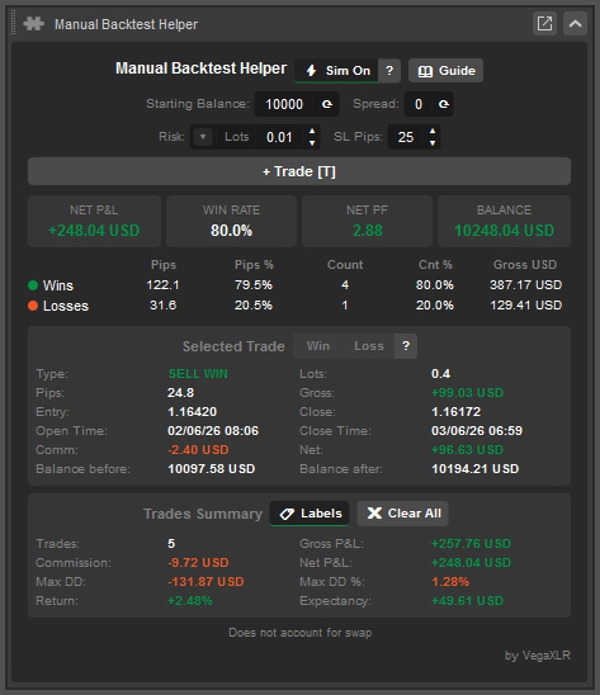
📈 실시간 KPI 타일
거래가 추가되거나 편집될 때마다 실시간으로 업데이트되는 항상 보이는 세 가지 주요 지표:
- 순 손익 — 수수료를 제외한 모든 거래의 총 수익/손실
- 승률 — 승리한 거래의 비율
- 순 수익률 — 순 수익 계수
- 잔고 — 백테스트 후 잔고
📋 승/패 통계 표
다섯 개 열로 나란히 표시되는 승리와 패배의 세부 내역:
- 총 핍
- 핍 % — 총 이동 핍 대비 비율
- 거래 수
- 수 % — 총 거래 대비 비율
- 총 화폐 가치
🔍 거래별 검사기
차트에서 거래를 클릭하면 전체 세부 정보를 확인할 수 있습니다:
- 유형 (예: BUY WIN, SELL LOSS, BUY AMBIG)
- 랏 크기
- 획득 또는 손실 핍
- 총 손익
- 진입 및 종료 가격
- 개시 및 종료 타임스탬프
- 수수료
- 순 손익 (수수료 제외 후)
- 선택된 거래 전 잔고
- 선택된 거래 후 잔고
📑 거래 요약 섹션
기록된 모든 거래에 대한 차트 수준 통계:
- 총 거래 수
- 총 손익
- 총 수수료
- 순 손익
- 최대 낙폭 (통화 기준)
- 최대 낙폭 비율
- 시작 잔고 대비 수익률 %
- 기대값 (거래당 평균 순 화폐 수익)
🏷️ 차트 내 레이블
- 거래 요약 헤더에서 거래 레이블을 직접 켜거나 끌 수 있습니다
🗑️ 확인 후 모두 삭제
- ✖ 모두 삭제 버튼은 기록된 모든 거래를 제거합니다
- 실행 전에 ✓ 확인 단계가 필요하여 실수로 삭제되는 것을 방지합니다
- ✗ 취소 는 작업을 중단합니다
⌨️ 키보드 단축키
- 승리선, 패배선, 거래 그리기 작업에 대한 구성 가능한 단축키
- 단축키 레이블은 작업 버튼에 직접 표시됩니다
💾 지속 상태
- 모든 거래, 설정 및 UI 값이 자동으로 저장됩니다
- 차트나 플랫폼을 다시 열 때 완전히 복원됩니다
🎨 테마 인식 UI
- 패널 색상, 버튼 상태, 상태 텍스트가 활성 테마에 맞게 조정됩니다
- 토글된 버튼은 활성 그리기 모드를 표시하기 위해 강조됩니다
요약
AI summary
VegaXLR - Manual Backtest Helper is a cTrader plugin designed for manual strategy backtesting directly on price charts without external tools. It enables traders to visually draw trades and instantly calculates key performance metrics such as win rate, profit factor, net profit and loss, maximum drawdown, and expectancy, updating these statistics in real time.
The plugin supports two recording modes: Manual Mode, where trades are drawn as trendlines with automatic direction detection, and Sim Mode, which allows placing full trade setups (entry, take profit, stop loss) that automatically resolve outcomes by scanning candle data. Ambiguous trades, where both target and stop loss are hit in the same candle, can be manually classified.
Risk sizing is flexible with three modes: fixed lot size, percentage of starting balance, or fixed monetary amount, with an automatic lot size calculator that respects symbol volume constraints. Configurable inputs include starting balance, spread, and stop loss pips, adjustable via spinner controls.
Users benefit from live KPI tiles showing net P&L, win rate, profit factor, and balance, a detailed win/loss stats table, and a per-trade inspector providing comprehensive trade details. Additional features include on-chart trade labels, keyboard shortcuts, persistent state saving, and a theme-aware user interface. This tool is suited for discretionary traders, strategy developers, and reviewers seeking objective edge analysis.
The plugin supports two recording modes: Manual Mode, where trades are drawn as trendlines with automatic direction detection, and Sim Mode, which allows placing full trade setups (entry, take profit, stop loss) that automatically resolve outcomes by scanning candle data. Ambiguous trades, where both target and stop loss are hit in the same candle, can be manually classified.
Risk sizing is flexible with three modes: fixed lot size, percentage of starting balance, or fixed monetary amount, with an automatic lot size calculator that respects symbol volume constraints. Configurable inputs include starting balance, spread, and stop loss pips, adjustable via spinner controls.
Users benefit from live KPI tiles showing net P&L, win rate, profit factor, and balance, a detailed win/loss stats table, and a per-trade inspector providing comprehensive trade details. Additional features include on-chart trade labels, keyboard shortcuts, persistent state saving, and a theme-aware user interface. This tool is suited for discretionary traders, strategy developers, and reviewers seeking objective edge analysis.
플러그인 프로필
플러그인 카테고리
유틸리티
데이터 액세스
시장 데이터
계정
차트
위험 모델
고정 랏
고정 위험 비율
동적
지원되는 위험 통제
손절매
이익실현
고객 리뷰
0.0
리뷰: 0
고객 리뷰
이 상품에 대한 리뷰가 아직 없습니다. 이미 사용해 보셨나요? 다른 사람들에게 가장 먼저 소개해 주세요!
상담
자주 묻는 질문(FAQ)
Chart UI Tools
Risk/Reward
Performance Report
Risk Calculator
Trade Statistics
트레이딩 봇, 지표, 플러그인 등 cTrader Store에서 제공되는 상품은 제3자 개발자에 의해 제공되며, 이는 단순히 정보 및 기술적 접근을 목적으로 제공된 것입니다. cTrader Store는 중개인이 아니며, 투자 조언, 개인별 추천 또는 향후 성과에 대한 어떠한 보장도 제공하지 않습니다.
이 작성자의 상품 더 보기

















가격
255
판매
1.49K
무료 설치