Descrizione
DESCRIZIONE COMPLETA
Battlezone Price Rejection Volume Profile
Indicatore cTrader Rejection Profile — Densità di Rifiuto Wick, Rilevamento di Inversione alla Barra Successiva e Zone di Calore a Livelli a Gradini con Livelli POC
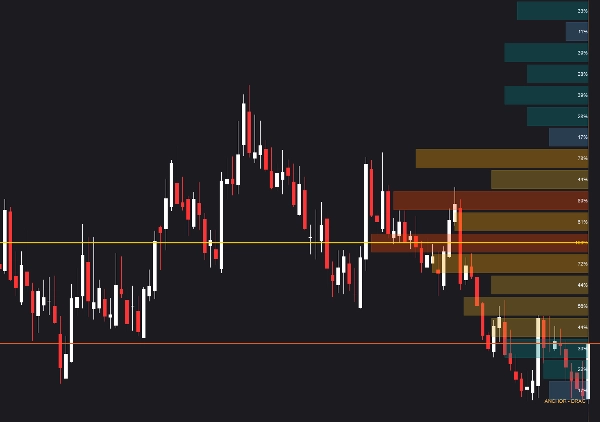
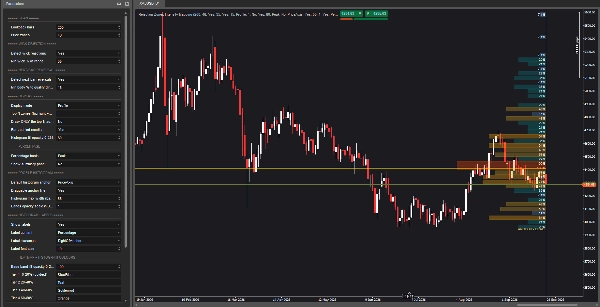
Battlezone Price Rejection Volume Profile è un indicatore cTrader che costruisce un profilo di rifiuto del prezzo invece del volume grezzo. Scansiona le barre storiche per rifiuti wick e inversioni alla barra successiva, li raggruppa in zone di prezzo e rende una mappa di calore a livelli a gradini con livelli POC — tutto ancorato a una linea profilo completamente trascinabile.
Invece di mostrare dove è stato scambiato il maggior volume, mostra dove il prezzo ha ripetutamente combattuto e fallito — uno strato strutturale che integra il profilo di volume, il profilo di mercato e l'analisi tradizionale di supporto/resistenza.
Nativo cTrader • Nessun Repainting su Barre Chiuse • Ancora e Confine Lookback Trascinabili • Mappa di Calore a Cinque Livelli
Cosa Fa l'Indicatore
Battlezone Price Rejection Volume Profile risponde a una domanda fondamentale:
Dove il prezzo è stato ripetutamente respinto — e quanto è intensa quella repulsione rispetto ad altre zone?
L'indicatore scansiona una finestra di lookback configurabile per due eventi di rifiuto:
- Rifiuti wick — candele in cui il wick superiore o inferiore supera una percentuale configurabile dell'intervallo della candela, indicando che il prezzo è stato respinto da un livello
- Inversioni alla barra successiva — una candela direzionale immediatamente seguita da una candela in direzione opposta, con una dimensione minima del corpo per qualificarsi
Ogni evento è raggruppato in una zona di prezzo. L'intensità della zona è calcolata, classificata e resa come un istogramma a livelli. Le zone più forti sono contrassegnate con livelli POC (Point of Control) che si estendono a destra del grafico.
Componenti Principali
Motore di Scansione del Rifiuto
Scansiona le ultime N barre (lookback configurabile, default 200). Rileva rifiuti wick e inversioni alla barra successiva indipendentemente — ciascuno può essere attivato o disattivato.
Rilevamento Rifiuto Wick
Una barra si qualifica come rifiuto wick quando il suo wick superiore o inferiore supera la percentuale minima configurata dell'intervallo (default: 35%). Ogni wick qualificante è assegnato alla zona di prezzo contenente la punta del wick.
Rilevamento Inversione alla Barra Successiva
Una barra si qualifica quando la barra successiva chiude in direzione opposta con una dimensione del corpo pari o superiore alla percentuale minima del corpo (default: 15%). Il prezzo ancora per l'inversione può essere impostato sulla chiusura, sull'estremo della barra di inversione o sull'estremo della struttura a due barre (default e raccomandato).
Raggruppamento delle Zone di Prezzo
L'intervallo di prezzo scansionato è diviso in un numero configurabile di zone (default: 48, massimo: 60). Ogni evento di rifiuto è assegnato alla sua zona corrispondente.
Mappa di Calore a Cinque Livelli
Le zone sono classificate in cinque livelli di intensità basati sul conteggio dei rifiuti rispetto al picco:
- Livello 1 — 0–20% (il più freddo) — default: SteelBlue
- Livello 2 — 20–40% — default: Teal
- Livello 3 — 40–60% — default: Goldenrod
- Livello 4 — 60–80% — default: Orange
- Livello 5 — 80–100% (il più caldo) — default: OrangeRed
Ogni livello ha il proprio colore configurabile.
Livelli POC
Le prime N zone sono contrassegnate con linee orizzontali POC che si estendono a destra. La zona più calda è etichettata "POC", le altre "P2", "P3" e così via. Le etichette possono includere opzionalmente l'intensità percentuale della zona.
Modalità di Visualizzazione
Tre modalità di visualizzazione:
- Profilo — barre istogramma che si estendono a sinistra dall'ancora
- Bande — bande di calore a tutta larghezza su tutto l'intervallo
- Entrambi — profilo con uno strato di banda di sfondo tenue
Linea Ancora Trascinabile
L'ancora del profilo è completamente trascinabile. Spostala per riposizionare l'intero istogramma. La posizione predefinita è sull'asse dei prezzi o appena oltre l'ultima candela — configurabile.
Confine Lookback Trascinabile
Una seconda linea trascinabile (teal per default) segna il bordo sinistro della finestra di lookback. Trascinala per includere più o meno barre.
Base Percentuale
Tre opzioni:
- Picco — percentuale della zona più calda (default: la più calda = 100%)
- Barre — percentuale delle barre di lookback (pressione assoluta)
- Eventi — quota di distribuzione su tutti i colpi
Pannello Riepilogativo Opzionale
Quando abilitato, mostra le prime 3 zone con i loro intervalli di prezzo, percentuali e conteggi dei colpi (ripartizione wick vs inversione).
Come Funziona
- Le ultime N barre vengono scansionate (lookback configurabile, default 200).
- Ogni barra viene valutata per:
-
- Rifiuto wick: wick superiore o inferiore ≥ % minima del wick dell'intervallo
- Inversione alla barra successiva: corpo direzionale seguito da un corpo in direzione opposta che soddisfa la % minima del corpo
- Gli eventi qualificanti sono assegnati alle zone di prezzo. L'intervallo di prezzo scansionato è diviso equamente in N zone.
- L'intensità della zona è calcolata come il conteggio degli eventi di rifiuto in ogni zona, normalizzata secondo la base percentuale selezionata.
- Le zone sono classificate per intensità. Le prime N zone sono contrassegnate come livelli POC.
- Ogni zona è resa come una barra istogramma orizzontale, dimensionata proporzionalmente alla sua intensità, colorata secondo il suo livello, con un'etichetta percentuale opzionale.
- Le linee POC si estendono dal bordo sinistro della finestra di lookback a destra dell'ancora.
Cosa Vedi sul Grafico
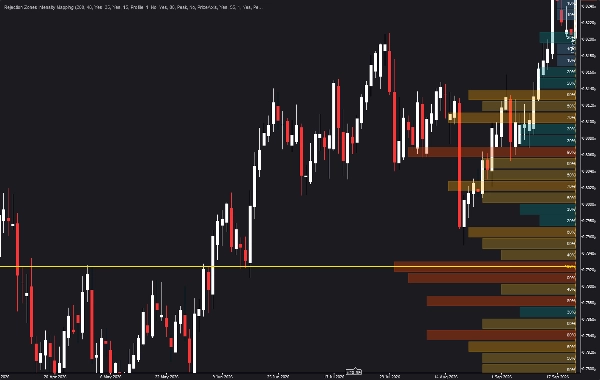
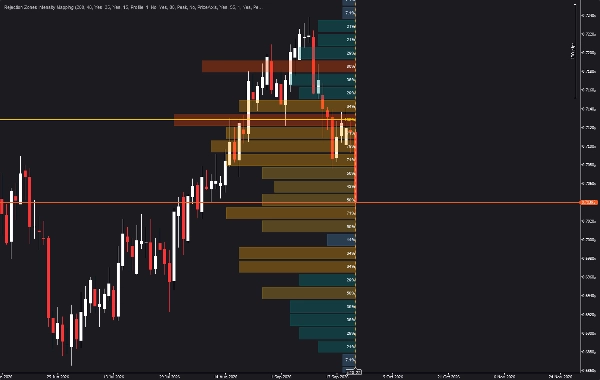
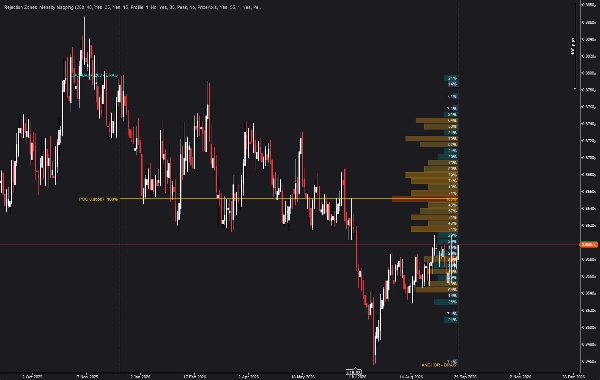
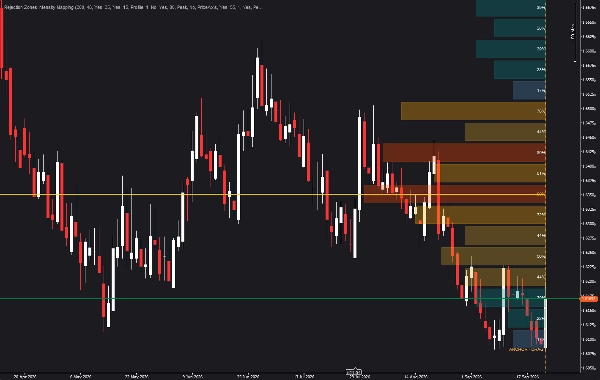
- Istogramma orizzontale che si estende a sinistra dalla linea ancora trascinabile
- Barre di zona dimensionate proporzionalmente all'intensità del rifiuto
- Cinque livelli di intensità codificati a colori (SteelBlue → Teal → Goldenrod → Orange → OrangeRed)
- Linee POC che si estendono a destra del grafico, con etichette
- Etichette percentuali opzionali su ogni zona
- Linea ancora ambra trascinabile (etichettata "ANCHOR – DRAG")
- Linea confine lookback teal trascinabile (etichettata "LOOKBACK – DRAG")
- Involucro di intervallo tenue opzionale con etichette HI/LO
- Pannello riepilogativo opzionale che mostra le prime 3 zone
Comportamento Storico e Non-Repainting
Tutte le scansioni di rifiuto e i calcoli di intensità della zona si basano su barre chiuse. I colori storici delle zone, le intensità e i livelli POC non cambiano una volta che le barre su cui si basano sono chiuse.
La barra attualmente in formazione non è conteggiata nell'intensità del rifiuto. Il suo wick potrebbe eventualmente qualificarsi come rifiuto, ma solo dopo la chiusura. Di conseguenza, il profilo è stabile fino alla chiusura della barra successiva, momento in cui il profilo si aggiorna una volta con i nuovi dati di rifiuto confermati.
Architettura dei Parametri
Scansione
Barre di lookback (default: 200) · Zone di prezzo (default: 48, max: 60)
Rifiuto Wick
Rileva rifiuti wick (Sì / No) · % minima del wick dell'intervallo (default: 35)
Inversione alla Barra Successiva
Rileva inversioni alla barra successiva (Sì / No) · % minima del corpo per qualificare la direzione (default: 15)
Visualizzazione
Modalità di visualizzazione (Profilo / Bande / Entrambi) · Prime N zone da evidenziare · Disegna SOLO le prime N zone (Sì / No) · Barre dietro le candele (Sì / No) · Opacità del riempimento istogramma (0–255)
Percentuale
Base percentuale (Picco / Barre / Eventi) · Mostra pannello riepilogativo (Sì / No)
Istogramma Profilo
Ancora istogramma predefinita (PriceAxis / LastBar) · Linea ancora trascinabile (Sì / No) · Larghezza massima istogramma in barre · Scala opacità bande in modalità ENTRAMBI
Etichette Istogramma
Mostra etichette (Sì / No) · Contenuto etichetta (Percentuale / Colpi / Entrambi) · Posizionamento etichetta (InsideBarCentered / RightOfAnchor / LeftOfBar) · Dimensione font etichetta
Colori Heatmap + Istogramma
Opacità riempimento banda base 0–255 · Colore Livello 1 · Colore Livello 2 · Colore Livello 3 · Colore Livello 4 · Colore Livello 5
Lookback Trascinabile
Confine lookback trascinabile (Sì / No)
Livelli POC
Linee POC sulle prime N zone (Sì / No)
Involucro di Intervallo
Involucro di intervallo tenue (Sì / No)
Scenari di Mercato Pratici
Trovare il Livello di Rifiuto Più Forte
Un cluster di zone di Livello 5 (OrangeRed) vicino a un precedente massimo oscillante rivela dove il prezzo è stato ripetutamente respinto. Questo livello diventa la linea POC superiore — il livello di rifiuto più forte nella finestra scansionata.
Distinguere Livelli Reali da quelli Deboli
Le zone di Livello 1 e Livello 2 (SteelBlue, Teal) appaiono in aree dove il prezzo è passato liberamente. Questi sono livelli a bassa convinzione e possono essere de-prioritizzati nella pianificazione del trading.
Analisi Specifica per Intervallo con l'Ancora Trascinabile
Trascina l'ancora ambra su un intervallo recente di massimo-minimo oscillante. Il profilo si ricostruisce per quell'intervallo, rivelando la struttura di rifiuto specifica per quel movimento — non l'intero lookback.
Regolare il Lookback con la Linea Teal
Trascina il confine lookback teal più a sinistra per includere più storia, o più a destra per concentrarti sull'azione del prezzo recente. Il profilo si ricostruisce immediatamente.
Prime N Zone per Grafici Puliti
Abilita "Disegna SOLO le prime N zone" e imposta N a 3 o 5. Vengono disegnati solo i livelli di rifiuto più forti — ideale per trader che vogliono grafici puliti senza perdere informazioni strutturali chiave.
Confluenza con il Profilo di Volume
Sovrapponi il profilo di rifiuto accanto a un profilo di volume tradizionale. Le zone in cui entrambi si allineano sono i livelli a più alta convinzione.
Compatibilità
- Piattaforma: cTrader (API cAlgo)
- Classi di asset: Forex, metalli inclusi XAUUSD, indici inclusi US30, NAS100 e GER40, materie prime e strumenti crypto
- Timeframe: Tutti i timeframe (da M1 a Mensile)
- Dati di volume: Non richiesti — il rilevamento del rifiuto usa solo l'azione del prezzo
- Dipendenze: Nessuna. cAlgo nativo, nessuna libreria esterna
Note Tecniche
L'indicatore è scritto interamente in cAlgo (C#). Il rilevamento del rifiuto usa solo l'azione del prezzo — non sono necessari dati di volume, rendendo l'indicatore ugualmente affidabile su strumenti con storia di volume limitata (crypto, alcuni CFD, coppie esotiche).
Le zone sono disegnate come oggetti rettangolari del grafico ancorati alla linea ancora trascinabile, con lunghezza della barra proporzionale all'intensità del rifiuto normalizzata. La colorazione delle zone segue la mappa di calore a cinque livelli configurata.
Sia la linea ancora del profilo che la linea confine lookback sono veri oggetti grafico cTrader — il che significa che li trascini direttamente sul grafico, e il profilo si ricostruisce di conseguenza. Gli eventi di scorrimento e zoom mantengono l'ancora correttamente posizionata sull'asse dei prezzi quando in modalità "Segui Grafico".
Le linee POC si estendono dal bordo sinistro della finestra di lookback a destra dell'ancora. La zona superiore è etichettata "POC" (linea solida); le zone secondarie sono etichettate "P2", "P3", ecc. (linee tratteggiate).
L'involucro di intervallo opzionale disegna un rettangolo tenue attorno all'intervallo di prezzo scansionato con etichette di prezzo HI/LO.
Per Chi È Questo Indicatore?
Battlezone Price Rejection Volume Profile è adatto a trader che vogliono:
- Un'alternativa basata sul rifiuto al profilo di volume tradizionale
- Una vista strutturata di dove il prezzo ha ripetutamente fallito
- Una mappa di calore visiva dell'intensità del rifiuto attraverso il prezzo
- Ancore trascinabili per analisi specifiche per intervallo
- Filtraggio Top N per chiarezza del grafico
- Livelli POC derivati dalla densità di rifiuto piuttosto che dal volume grezzo
Usalo insieme a metodologie più ampie che coinvolgono azione del prezzo, struttura di mercato, analisi del volume, ritorno alla media o ricerca di continuazione del trend.
L'indicatore fornisce una visualizzazione analitica — non un segnale di acquisto o vendita.
Acquisto
Battlezone Price Rejection Volume Profile è disponibile tramite il cTrader Store. Il tuo acquisto include accesso a vita, personalizzazione della mappa di calore a cinque livelli, linee ancora e lookback trascinabili e supporto diretto dello sviluppatore.
Battlezone Price Rejection Volume Profile — Profilo di Rifiuto cTrader | Profilo di Volume di Rifiuto | Zone di Rifiuto Wick | Rilevamento Inversione alla Barra Successiva | Mappa di Calore di Rifiuto | Intensità della Zona di Prezzo | Livelli POC | Indicatore cTrader | Indicatore cAlgo | Zone Non-Repainting | Mappa di Calore Supporto Resistenza | Profilo Ancora Trascinabile | Mappatura a Livelli di Zona | Indicatore XAUUSD | Indicatore US30 | Indicatore NAS100 | Indicatore Struttura di Mercato | Densità di Rifiuto | Indicatore Battlezone
Riepilogo
The indicator features a fully draggable anchor line and lookback boundary for range-specific analysis, allowing users to reposition the profile and adjust the historical window dynamically. The strongest rejection zones are marked with Point of Control (POC) levels extending horizontally on the chart. Display modes include histogram profiles, full-width heat bands, or both combined. An optional summary panel highlights the top rejection zones with detailed statistics.
Designed for use across all timeframes and various asset classes—including forex, metals, indices, commodities, and cryptocurrencies—this tool requires no volume data, relying solely on price action. It provides a structural layer complementary to volume profile and support/resistance analysis, aiding traders in identifying key price levels where price has repeatedly failed. The indicator is non-repainting and native to cTrader’s cAlgo API.
Recensioni dei clienti
5 | 100 % | |
4 | 0 % | |
3 | 0 % | |
2 | 0 % | |
1 | 0 % |