
설명
라운드 넘버 레벨 - cTrader용 인디케이터
설명
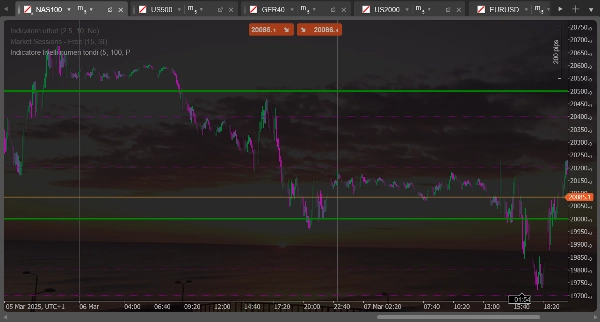
이 인디케이터는 차트에 "라운드 넘버" 또는 심리적으로 중요한 수준에 수평선을 그립니다. 이는 트레이더에게 심리적으로 중요한 경우가 많은 라운드 가격 수준을 기반으로 잠재적인 지지 및 저항 영역을 식별하는 데 이상적입니다.
주요 기능
- 규칙적인 간격으로 두 개의 구별된 수평선 세트를 그립니다
- 현재 종가를 기준으로 레벨을 자동으로 계산합니다
- 가격이 움직일 때 동적으로 업데이트됩니다
- 각 선 세트별로 별도의 구성(색상, 스타일, 크기)을 제공합니다
가능한 조정
첫 번째 선 세트(점선)의 경우
- 선 수 세트 1: 현재 가격 위아래로 그릴 선의 수를 결정합니다(기본값: 5)
- 범위 크기 세트 1: 선 간 거리를 핍 단위로 설정합니다(기본값: 100 핍)
- 선 색상 세트 1: 선의 색상을 사용자 지정합니다(기본값: 보라색)
- 선 두께 세트 1: 선의 두께를 설정합니다(기본값: 1픽셀)
두 번째 선 세트(실선)의 경우
- 선 수 세트 2: 현재 가격 위아래로 그릴 선의 수를 결정합니다(기본값: 2)
- 범위 크기 세트 2: 선 간 거리를 핍 단위로 설정합니다(기본값: 500 핍)
- 선 색상 세트 2: 선의 색상을 사용자 지정합니다(기본값: 녹색)
- 선 두께 세트 2: 선의 두께를 설정합니다(기본값: 1픽셀)
실용적인 사용법
일반적으로 첫 번째 세트(점선)는 소규모 심리적 수준을 식별하는 데 사용되고, 두 번째 세트(실선)는 주요 심리적 수준을 강조합니다. 예를 들어 EURUSD의 경우 첫 번째 세트를 100핍마다 레벨을 표시하도록 설정할 수 있습니다(예: 1.0800, 1.0900) 그리고 두 번째 세트는 500핍마다 레벨을 표시하도록 설정할 수 있습니다(예: 1.0500, 1.1000).
이러한 레벨은 종종 가격이 반등하거나 움직임을 계속하기 전에 속도가 느려질 수 있는 지지 또는 저항 구역과 일치합니다.
Round Number Levels - Indicator for cTrader
Description
This indicator draws horizontal lines at "round numbers" or psychologically significant levels on the chart. It's ideal for identifying potential support and resistance areas based on round price levels that often have psychological importance for traders.
Main Features
- Draws two distinct sets of horizontal lines at regular intervals
- Automatically calculates levels based on the current closing price
- Updates dynamically as price moves
- Offers separate configuration for each set of lines (color, style, size)
Possible Adjustments
For the first set of lines (dashed)
- Number of Lines Set 1: Determines how many lines to draw above and below the current price (default: 5)
- Range Size Set 1: Sets the distance between lines in pips (default: 100 pips)
- Line Color Set 1: Customizes the color of the lines (default: purple)
- Line Width Set 1: Sets the thickness of the lines (default: 1 pixel)
For the second set of lines (solid)
- Number of Lines Set 2: Determines how many lines to draw above and below the current price (default: 2)
- Range Size Set 2: Sets the distance between lines in pips (default: 500 pips)
- Line Color Set 2: Customizes the color of the lines (default: green)
- Line Width Set 2: Sets the thickness of the lines (default: 1 pixel)
Practical Usage
Typically, the first set (dashed lines) is used to identify minor psychological levels, while the second set (solid lines) highlights major psychological levels. For example, for EURUSD, you might set the first set to show levels every 100 pips (such as 1.0800, 1.0900) and the second set for levels every 500 pips (such as 1.0500, 1.1000).
These levels often coincide with support or resistance zones where price might bounce or slow down before continuing its movement.
요약
고객 리뷰
5 | 50 % | |
4 | 50 % | |
3 | 0 % | |
2 | 0 % | |
1 | 0 % |


!["[CB] Pivot Points Pro" 로고](https://cdn.ctrader.com/image/webp/43463c82-67b0-4f10-a4ba-901bba091d81_32594)


