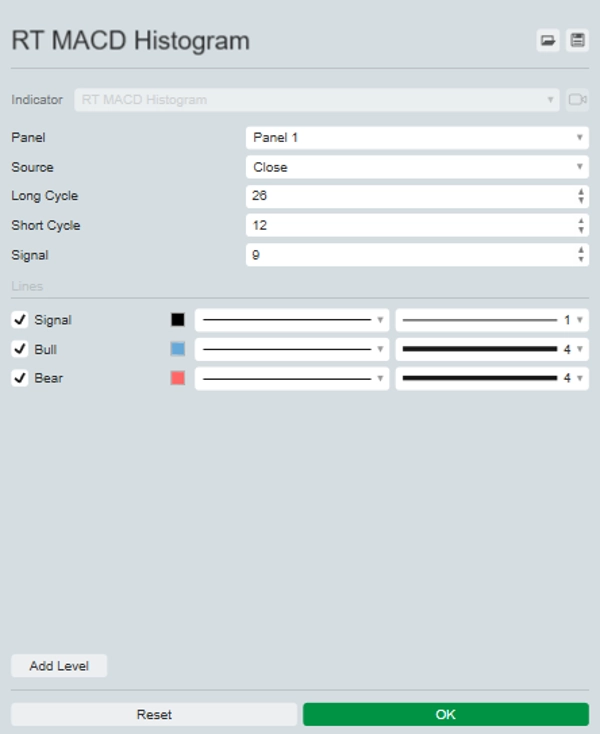
RT MACD Histogram
อินดิเคเตอร์
เวอร์ชัน 1.0, Sep 2024
Windows, Mac
คำอธิบาย
แนะนำ MACD Histogram ที่ได้รับการปรับปรุง เพื่อมอบประสบการณ์การเทรดที่ชัดเจนและลึกซึ้งยิ่งขึ้น
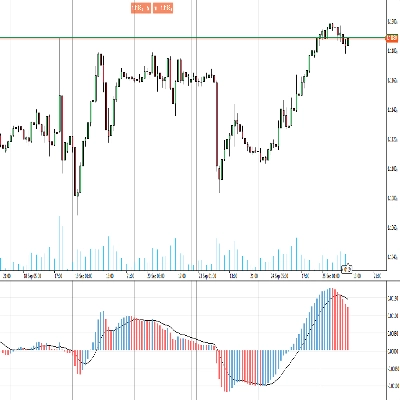
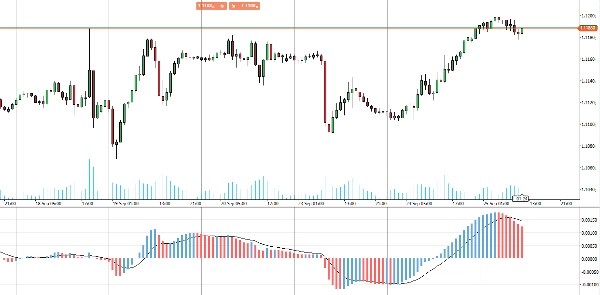
อินดิเคเตอร์ที่อัปเกรดนี้แสดงฮิสโตแกรมสีสันสดใสที่แยกความแตกต่างระหว่างการเปลี่ยนแปลงราคาขาขึ้นและขาลง ซึ่งเกินกว่ารูปแบบสีเดียวเริ่มต้น ด้วยการใช้สีที่แตกต่างกันสำหรับการเคลื่อนไหวในเชิงบวกและลบ มันให้สัญญาณภาพที่ชัดเจนทันทีเกี่ยวกับสภาพตลาด ทำให้ง่ายต่อการตีความการเปลี่ยนแปลงโมเมนตัมและการกลับตัวของแนวโน้มที่อาจเกิดขึ้น
เหมาะสำหรับเทรดเดอร์ที่ต้องการความชัดเจนและความแม่นยำที่เพิ่มขึ้น MACD Histogram การอัปเกรดนี้เปลี่ยนแผนภูมิของคุณให้กลายเป็นเครื่องมือวิเคราะห์ที่ทรงพลังยิ่งขึ้น ยกระดับกลยุทธ์การเทรดของคุณด้วย MACD Histogram ที่ได้รับการปรับปรุง
สรุป
โปรไฟล์อินดิเคเตอร์
รีวิวจากลูกค้า
0.0
รีวิว: 0
รีวิวจากลูกค้า
ยังไม่มีรีวิวสำหรับผลิตภัณฑ์นี้ หากเคยลองแล้ว ขอเชิญมาเป็นคนแรกที่บอกคนอื่น!
การสนทนา
คำถามที่พบบ่อย
BTCUSD
Forex
Signal
Indices
EURUSD
Commodities
GBPUSD
NZDUSD
Prop
Scalping
Crypto
Stocks
XAUUSD
NAS100
MACD
USDJPY
ผลิตภัณฑ์ที่มีให้บริการผ่าน cTrader Store รวมถึงบอทการเทรด อินดิเคเตอร์ และปลั๊กอิน มีให้บริการโดยนักพัฒนาบุคคลที่สามและมีไว้เพื่อวัตถุประสงค์ในการเข้าถึงข้อมูลและทางเทคนิคเท่านั้น cTrader Store ไม่ใช่โบรกเกอร์และไม่ได้ให้คำแนะนำการลงทุน คำแนะนำส่วนบุคคล หรือการรับประกันผลการดำเนินงานในอนาคต


ราคา
ตั้งแต่ 25/09/2024
20
การขาย