
Descrição
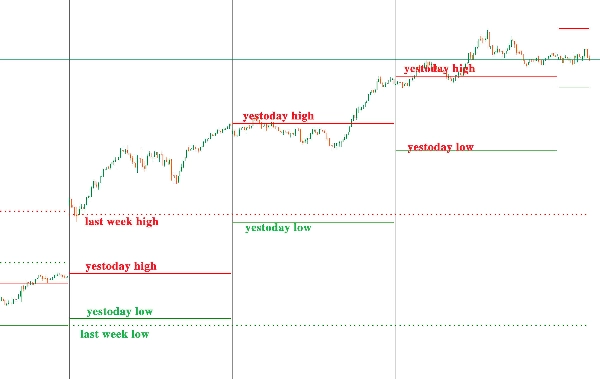
O indicador "Níveis Diários" é usado para exibir a máxima/mínima da semana passada e a máxima/mínima de ontem em diferentes períodos de tempo.
Máxima/mínima da semana passada: Marcada com linhas tracejadas grossas;
Máxima/mínima de ontem: Marcada com linhas sólidas finas.
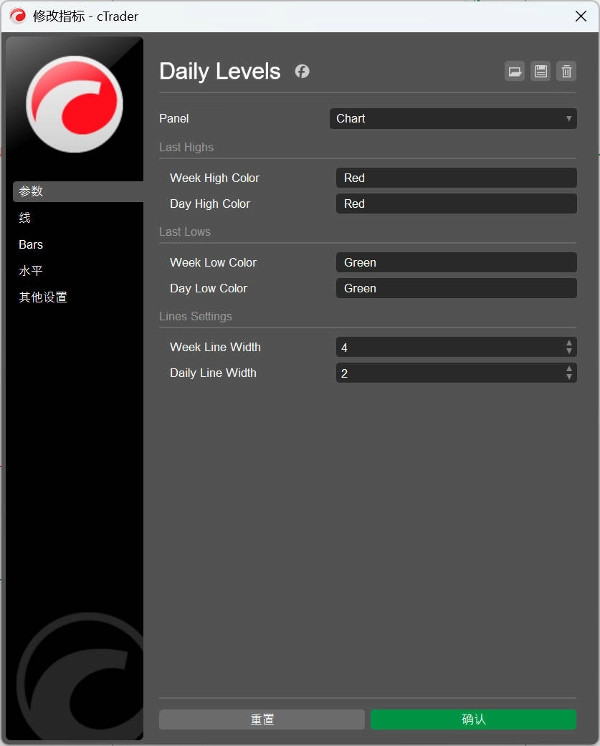
Os usuários podem personalizar as cores e a espessura das linhas.
“Daily Levels”指标用于在不同的时框框架下显示上周最高价/最低价和昨天最高价/最低价。
上周最高/最低价:使用粗虚线标注;
昨天最高/最低价:使用细实线标注。
用户可以自定义颜色和线条粗细。
Resumo
Perfil do indicador
Avaliações de clientes
0.0
Avaliações: 0
Avaliações de clientes
Ainda não há avaliações para este produto. Já o experimentou? Seja o primeiro a contar a outras pessoas!
Conversa
Perguntas frequentes
Forex
Signal
Breakout
Indices
Commodities
Crypto
Os produtos disponíveis através da cTrader Store, incluindo bots de negociação, indicadores e plugins, são fornecidos por programadores terceiros e são disponibilizados apenas para fins informativos e de acesso técnico. A cTrader Store não é um corretor e não fornece aconselhamento em matéria de investimento, recomendações pessoais ou qualquer garantia de desempenho no futuro.


Preço
Desde 30/09/2024
44
Vendas