
Opis
**Vmm Signal Trend Pro - wskaźnik dla cTrader**
**Opis ogólny**
Vmm Signal Trend Pro to zaawansowany wskaźnik analizy technicznej dla platformy cTrader, który wykrywa wiele wzorców cenowych w czasie rzeczywistym. Łączy wykrywanie trendów, wzorce świecowe, FVG (Fair Value Gaps), luki oraz inne ważne wzorce w jeden wizualny wskaźnik.
**Główne cechy**
**1. Wykrywanie trendu**
- **Analiza Price Action**: Identyfikuje trendy na podstawie price action z ostatnich N świec
- **Siła trendu**: Oblicza procentową siłę na podstawie momentum i struktury
- **Ikony kierunkowe**: Zielona strzałka (w górę) lub czerwona strzałka (w dół), gdy trend jest silny
**2. Wykryte wzorce**
**Fair Value Gap (FVG)**
- **Byczy FVG**: Gdy obecne minimum > maksimum sprzed 2 świec
- **Niedźwiedzi FVG**: Gdy obecne maksimum < minimum sprzed 2 świec
- **Kolorowe obszary**: Półprzezroczyste prostokąty (zielone/pomarańczowe)
**Luki (Gaps)**
- **Luka wzrostowa**: Otwarcie powyżej poprzedniego maksimum
- **Luka spadkowa**: Otwarcie poniżej poprzedniego minimum
- **Wizualizacja**: Małe prostokąty przy otwarciu świecy
**Inside Bars**
- Świeca całkowicie mieszcząca się w zakresie poprzedniej świecy
- Rozróżnienie kolorem (żółty/pomarańczowy) w zależności od kierunku
**Wzorzec 123 (odwrócony)**
- **Byczy wzorzec 123**: Trzy punkty z wybiciem w górę
- **Niedźwiedzi wzorzec 123**: Trzy punkty z wybiciem w dół
- **Sygnalizacja**: Ikona kołowa w kolorze złotym
**Wzorce knota**
- **Podobne do młotka**: Znaczący dolny knot
- **Podobne do spadającej gwiazdy**: Znaczący górny knot
- **Ikona**: Magenta gwiazda
**Pin Bars**
- Długi knot (≥2x korpusu) z małym korpusem
- Wykrywanie pobliskich kluczowych poziomów
- **Ikony**: Trójkąty w górę/w dół (cyjan)
**Formacje objęcia (Engulfing)**
- **Bycza formacja objęcia**: Bycza świeca obejmuje poprzednią niedźwiedzią
- **Niedźwiedzia formacja objęcia**: Niedźwiedzia świeca obejmuje poprzednią byczą
- **Ikona**: Fioletowy diament
**Doji**
- Bardzo mały korpus (domyślnie ≤10% całkowitego zakresu)
- Specjalne typy: Gravestone, Dragonfly, Long-Legged
- **Ikona**: Szare koło
**3.** System wsparcia/oporu**
- Automatyczne wykrywanie swingowych maksimów/minimów
- Uwzględnia bliskość kluczowych poziomów dla zwiększenia znaczenia
**4. Inteligentne filtrowanie**
- **Limit według typu**: Maksymalna liczba sygnałów na kategorię
- **Odstęp czasowy**: Unika sygnałów zbyt blisko siebie
- **Filtr trendu**: Opcja zezwalająca/odrzucająca sygnały przeciwtrendu
- **Minimalna siła**: Filtruje słabe sygnały
**Konfigurowalne parametry**
**Podstawowe**
- `Pokaż kierunek trendu`: Aktywuje strzałki trendu
- `Sprawdzenie poprzednich świec`: Liczba świec do analizy
- `Próg siły trendu`: Minimalny procent do uznania trendu za silny
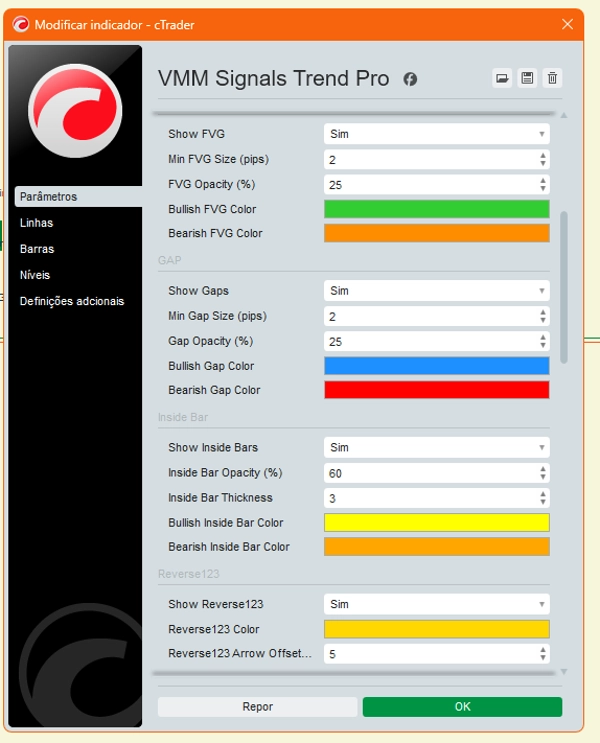
**FVG**
- `Minimalny rozmiar FVG`: Minimalny rozmiar w pipsach
- `Przezroczystość`: Przezroczystość obszarów
- `Kolory`: Kolory do personalizacji
**Luki (Gaps)**
- `Minimalny rozmiar luki`: Minimalny rozmiar w pipsach
- `Kolory`: Kolory dla luk wzrostowych/spadkowych
**Inside Bars**
- `Grubość`: Grubość linii
- Przezroczystość: Przezroczystość
- Kolory: Kolory rozróżnione według kierunku
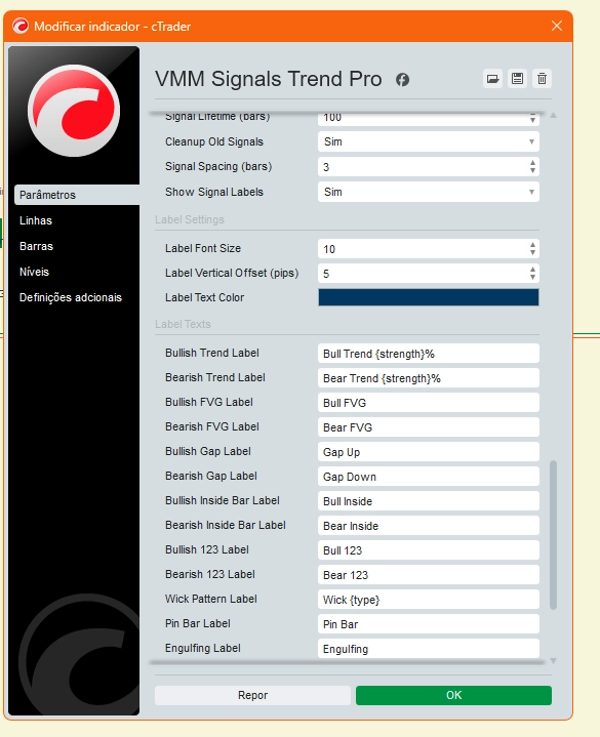
Sygnały:
- Czas życia sygnału: Czas trwania sygnału (w świecach)
- Odstęp sygnałów: Minimalny odstęp między sygnałami
- Maksymalna liczba sygnałów na typ: Limit na kategorię
Etykiety niestandardowe:
- Tekst konfigurowalny: Każdy wzorzec ma własny konfigurowalny tekst
- Zastępniki: `{strength}` dla % siły, `{type}` dla konkretnego typu
- Formatowanie: Rozmiar czcionki, przesunięcie pionowe, kolory
- Tryb skrócony: Skrócone etykiety dla gęstych wykresów
Mechanika wewnętrzna:
1. Analiza trendu:
- Regresja liniowa: Oblicza nachylenie trendu
- Liczba świec: Bycze vs. niedźwiedzie w ostatnich N okresach
- Momentum: Uwzględnia wielkość ruchów
2. Zarządzanie obiektami**
- **Pamięć obiektów**: Zapobiega ponownemu rysowaniu istniejących sygnałów
- **Automatyczne czyszczenie**: Usuwa stare sygnały na podstawie czasu życia
- **Liczniki według typu**: Kontroluje maksymalną ilość
**3. **Obliczanie siły**
- Każdy wzorzec ma własny wzór na siłę
- Bazuje na proporcjach, odległościach w pipsach, bliskości kluczowych poziomów
- Zakres: 0-100%
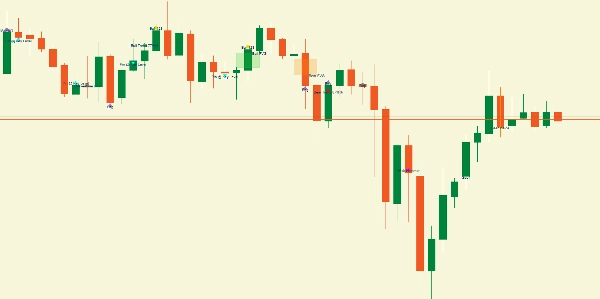
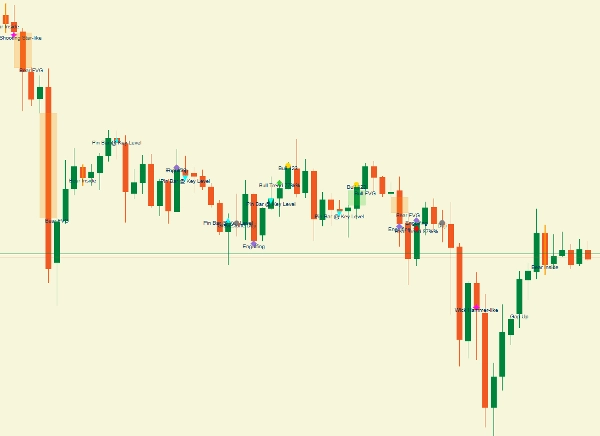
**Wizualizacja na wykresie**
**Elementy wykresu**
1. **Ikony**: Strzałki, trójkąty, koła, diamenty, gwiazdy
2. **Obszary**: Półprzezroczyste prostokąty (FVG/Luki)
3. **Linie**: Podświetlone inside bars
4. **Etykiety**: Informacyjny tekst obok sygnałów
**Kod kolorów**
- **Zielony**: Byczy (trend, FVG, luki)
- **Czerwony/Pomarańczowy**: Niedźwiedzi (trend, FVG, luki)
- **Żółty/Pomarańczowy**: Inside bars (bycze/niedźwiedzie)
- **Złoty**: Wzorzec 123
- **Magenta**: Wzorce knota
- **Cyjan**: Pin bars
- **Fioletowy**: Formacje objęcia
- **Szary**: Doji
**Zalety**
**Dla traderów**
- **Wszystko w jednym**: Wiele wzorców w jednym wskaźniku
- **Konfigurowalny**: Precyzyjne dostosowanie każdego wzorca
- **Czytelna wizualizacja**: Intuicyjne kodowanie kolorami
- **Filtrowanie**: Zapobiega przeciążeniu sygnałami
**Zastosowania**
**1. Szybka analiza**
- Identyfikacja dominującego trendu
- Sprawdzenie ostatnich FVG i luk
- Wykrywanie wzorców odwrócenia
**2. Potwierdzenie wejścia**
- Łączenie wielu wzorców dla zwiększenia prawdopodobieństwa
- Sprawdzenie zgodności z trendem
- Uwzględnienie siły sygnału
**3. Zarządzanie ryzykiem**
- Identyfikacja pobliskich poziomów wsparcia/oporu
- Wykorzystanie FVG jako obszarów zainteresowania
- Uwzględnienie odstępów między sygnałami
**Ograniczenia**
**Zależności**
- **Rynki zmienne**: Może generować wiele sygnałów
- **Interwały czasowe**: Ustawienia mogą wymagać dostosowania dla różnych interwałów
- **Instrumenty**: Zachowanie różni się w zależności od pary walutowej
**Uwagi**
- **Nie jest prognostyczny**: Wzorce z przeszłości ≠ gwarancja przyszłości
- **Wymagana weryfikacja**: Zawsze potwierdzaj dodatkowymi analizami
- **Fałszywe sygnały**: Filtry je redukują, ale nie eliminują
**Rekomendacje użytkowania**
**Ustawienia początkowe**
1. Zacznij od `Smart Filtering = true`
2. Dostosuj `Min Signal Strength` do swojego stylu
3. Użyj `Signal Spacing`, aby uniknąć przeciążenia
4. Dostosuj kolory dla lepszej wizualizacji
**Skuteczne kombinacje**
- **Trend + FVG**: Silne dopasowanie
- **Inside bar + kluczowy poziom**: Dobre miejsce na wejście
- **Pin bar + formacja objęcia**: Potwierdzenie odwrócenia
- **123 + trend**: Prawdopodobna kontynuacja
**Monitorowanie**
- Regularnie sprawdzaj logi w konsoli
- Dostosuj parametry do rynku
- Używaj w połączeniu z innymi wskaźnikami
Ten wskaźnik to kompletne narzędzie dla traderów poszukujących kompleksowej analizy technicznej skoncentrowanej na price action i wzorcach wizualnych, oferujące pełną elastyczność w dostosowywaniu i filtrowaniu sygnałów.
**⚠️ WAŻNE ZASTRZEŻENIE**
Ten wskaźnik jest NARZĘDZIEM ANALIZY TECHNICZNEJ. Generowane sygnały są SUGESTIAMI opartymi na algorytmach, a NIE rekomendacjami inwestycyjnymi. Handel wiąże się z istotnym ryzykiem straty. Wyniki historyczne nie gwarantują przyszłych rezultatów. Trader ponosi PEŁNĄ ODPOWIEDZIALNOŚĆ za wszystkie decyzje handlowe. Zawsze stosuj odpowiednie zarządzanie ryzykiem i testuj na kontach demo przed handlem na żywo.


