Opis
Wskaźnik Kalman Filter dla cTrader 5.5+ zapewnia czysty, adaptacyjny obraz trendu rynkowego, dynamicznie reagując na zmieniające się warunki cenowe.
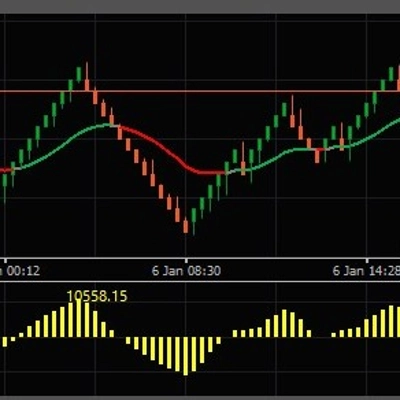
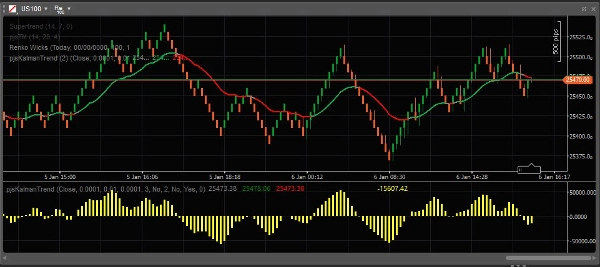
Opierając się na samoadaptującym się algorytmie Kalmana, wskaźnik rysuje gładką linię filtra trendu, która redukuje szumy bez wprowadzania nadmiernego opóźnienia. W miarę zmiany dynamiki rynku filtr automatycznie się dostosowuje — co czyni go odpowiednim zarówno na fazy trendu, jak i przejściowe.
Kluczowe cechy obejmują zmiany koloru oparte na trendzie dla natychmiastowej informacji wizualnej, opcjonalny histogram do oceny momentum i biasu oraz możliwość wykresu na głównym wykresie lub w osobnym oknie, aby dopasować się do różnych stylów pracy i strategii.
Zaprojektowany do praktycznego użytku handlowego, wskaźnik jest lekki, wydajny (obliczany przy zamknięciu świecy), konfigurowalny i wolny od okienek przypominających lub przerw — pozwalając skupić się całkowicie na realizacji i analizie.
Funkcje
- Samoadaptujący się filtr trendu Kalmana
- Gładka, niskoszumowa wizualizacja trendu
- Automatyczne zmiany koloru w zależności od kierunku trendu
- Opcjonalny wyświetlacz histogramu
- Wykres lub wykres w osobnym oknie
- Kompatybilny z cTrader 5.5+
- Brak okienek przypominających
Ten wskaźnik jest idealny dla traderów poszukujących czystego, adaptacyjnego filtra trendu, który płynnie integruje się z podejściami dyskrecjonalnymi lub systematycznymi.
Podsumowanie
Opinie klientów
5 | 50 % | |
4 | 50 % | |
3 | 0 % | |
2 | 0 % | |
1 | 0 % |


