
Pulse Radar: Profesjonalna analiza dynamiki momentum i cykli
Wskaźnik Pulse Radar to zaawansowany zestaw analityczny dla platform opartych na C#, zaprojektowany do dekodowania zmienności rynku i identyfikacji faz rozwoju cen o wysokim prawdopodobieństwie. W przeciwieństwie do tradycyjnych wskaźników opóźnionych, Pulse Radar stosuje adaptacyjną ocenę stref równowagi cenowej, dostarczając wyraźną mapę strukturalną rynku.
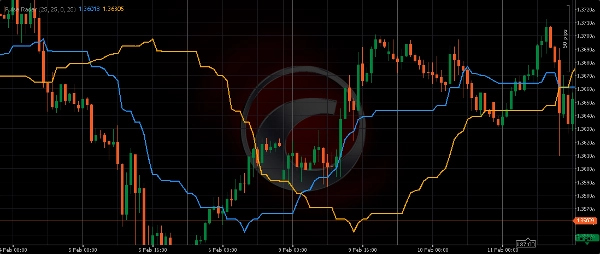
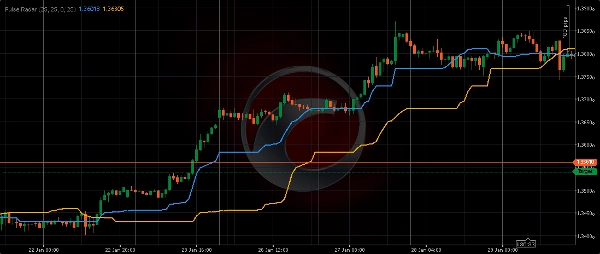
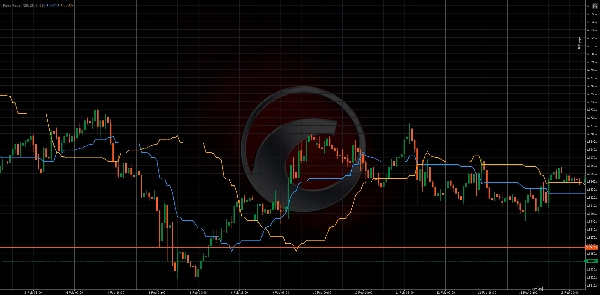
System konstruuje dwie autorskie krzywe analityczne:
- Wektor Aktywny (Szybki): Linia o wysokiej responsywności odzwierciedlająca natychmiastowe momentum i krótkoterminowe zmiany płynności.
- Wektor Strategiczny (Wolny): Wygładzona krzywa reprezentująca dominujący cykl rynkowy i instytucjonalną równowagę cenową.
Analizując pozycję ceny względem tych krzywych, traderzy mogą dokładnie określić aktualną fazę rynku w szerszej hierarchii cyklicznej. Pulse Radar oferuje również zaawansowane dopasowanie historyczne, umożliwiające bezpośrednie porównanie bieżących ruchów strukturalnych z przeszłymi wzorcami zachowań.
Metodologia techniczna
- Analiza punktów ekstremalnych: Linie są obliczane na podstawie surowych ekstremów cen w określonych oknach czasowych, eliminując szumy występujące w standardowych średnich kroczących.
- Synchronizacja faz: Algorytm wspiera ręczne i automatyczne korekty przesunięcia, aby dopasować dane do historycznych segmentów wykresu.
- Interakcja strukturalna: Zbieżność i rozbieżność wektorów Aktywnego i Strategicznego podkreśla przejścia między fazami akumulacji i dystrybucji trendu.
Kluczowe zalety
- Precyzja bez wygładzania: Obliczenia wykorzystują surowe dane rynkowe, zapewniając brak sztucznego opóźnienia.
- Adaptacyjna struktura: W pełni konfigurowalne parametry dopasowujące się do specyficznego profilu zmienności dowolnego aktywa.
- Uniwersalność międzyrynkowa: Optymalizowany dla rynku Forex o wysokiej częstotliwości, akcji amerykańskich, towarów i kryptowalut.
- Wysokowydajna architektura: Lekka logika C# zapewnia zerowy wpływ na stabilność platformy podczas wysokiej zmienności.
Parametry wejściowe
- Okres zasięgu (Szybki/Wolny): Określa głębokość danych rynkowych używanych do obliczania wektorów momentum.
- Przesunięcie fazy (Szybki/Wolny): Umożliwia precyzyjną kalibrację linii analitycznych względem historycznych struktur cenowych.
5 | 100 % | |
4 | 0 % | |
3 | 0 % | |
2 | 0 % | |
1 | 0 % |


![Logo „Gaussian Channel [Iridio Capital]”](https://cdn.ctrader.com/image/webp/7c039209-5573-4a54-a072-f9528b503103_41960)