
Opis
HiLo Marker: Odkryj kluczowe punkty zwrotne na rynku
HiLo Marker to intuicyjny i niezbędny wskaźnik cTrader zaprojektowany do automatycznego wykrywania i wyróżniania istotnych maksimów i minimów cenowych na podstawie określonego okna historycznego. To narzędzie wprowadza przejrzystość na Twoje wykresy, eliminując zgadywanie przy identyfikacji punktów zwrotnych, oferując wizualną przewagę dla każdego tradera działającego na podstawie analizy ruchu cen.
Jak to działa
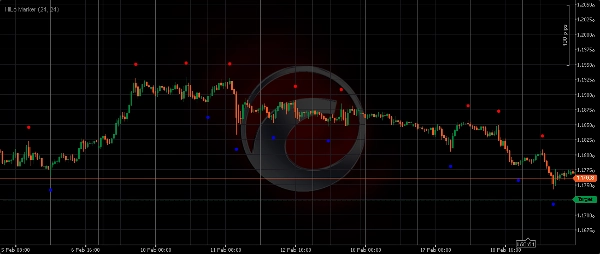
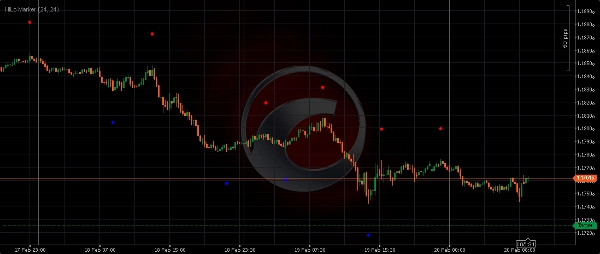
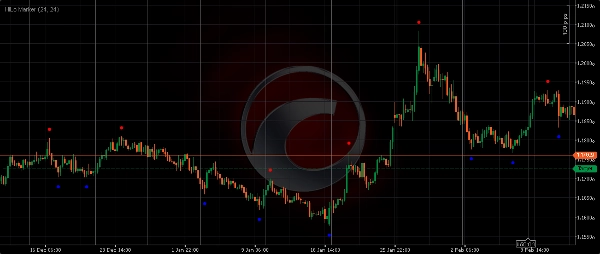
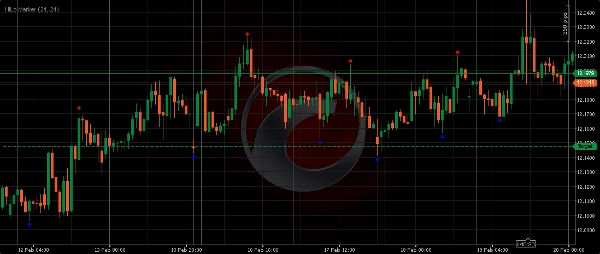
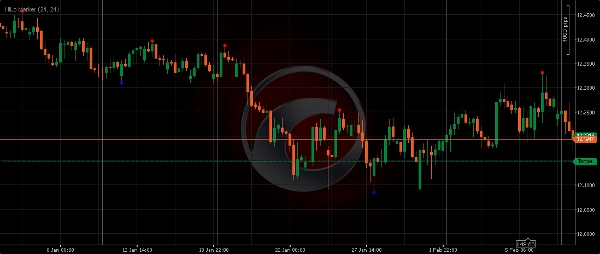
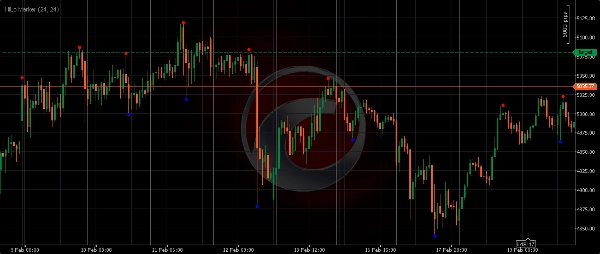
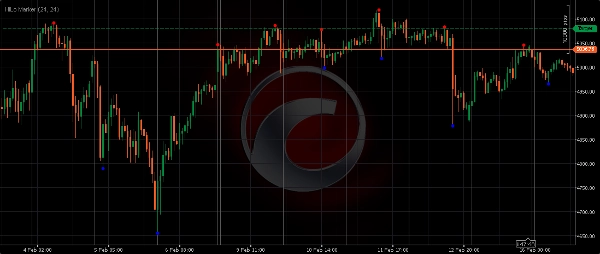
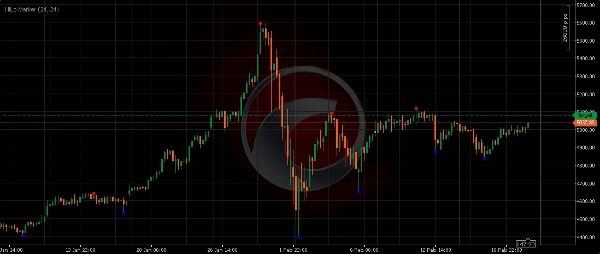
Wskaźnik skanuje określone "Okno Odległości" (liczbę słupków), aby znaleźć absolutnie najwyższy szczyt i najniższy dołek w tym zakresie. Gdy słupek zostanie potwierdzony jako szczyt lub dno w swoim otoczeniu, HiLo Marker umieszcza wyraźną czerwoną lub niebieską kropkę (lub strzałkę) nad/pod tym świecznikiem. Ta metoda pomaga obiektywnie wskazać kluczowe poziomy, gdzie cena wcześniej się odwróciła lub znalazła silny impet.
Kluczowe cechy i korzyści
- Automatyczna precyzja: Koniec z ręcznym rysowaniem linii. HiLo Marker obiektywnie identyfikuje krytyczne punkty zwrotne.
- Jasna struktura rynku: Natychmiastowa wizualizacja wahnięć, trendów i zakresów, co czyni analizę wykresów bardziej efektywną.
- Strefy wsparcia i oporu: Oznaczone maksima i minima często działają jako przyszłe wsparcie i opór, oferując punkty wejścia/wyjścia o wysokim prawdopodobieństwie.
- Wszechstronność: Działa bezbłędnie na wszystkich instrumentach finansowych (Forex, Złoto, Indeksy, Kryptowaluty, Akcje) i na dowolnym interwale czasowym.
- Dostosowywalne wizualizacje: Dostosuj kolory markerów i odległość przesunięcia dla idealnej integracji z wykresem.
Wyjaśnienie parametrów wejściowych:
- Długość (Przesunięcie): Ta wartość określa, jak daleko powyżej maksimum lub poniżej minimum zostanie umieszczony marker. Większa wartość tworzy większe wizualne oddzielenie od świecy.
-
- Przykład:
Długość = 24oznacza, że marker pojawi się 24 pipsy (lub ticki, w zależności od symbolu) od rzeczywistego maksimum/minimum.
- Przykład:
- Okno odległości: To okres cofania, którego wskaźnik używa do identyfikacji maksimum lub minimum. Słupek jest oznaczany jako Hi/Lo tylko wtedy, gdy jest absolutnie najwyższy/najniższy w określonej liczbie otaczających słupków.
-
- Mniejsze
Dist(np. 10-20): Rejestruje drobne wahania i krótkoterminowy szum rynkowy (odpowiednie do skalpowania). - Większe
Dist(np. 30-60+): Identyfikuje bardziej znaczące, instytucjonalne wahania i główne odwrócenia trendu (idealne do swing tradingu lub wyższych interwałów czasowych).
- Mniejsze
Ulepsz swoją strategię tradingu ruchu cenowego z HiLo Marker. Zyskaj jaśniejszą perspektywę dynamiki rynku i podejmuj bardziej świadome decyzje. Pobierz teraz!
Podsumowanie
Opinie klientów
5 | 0 % | |
4 | 100 % | |
3 | 0 % | |
2 | 0 % | |
1 | 0 % |


