
Opis
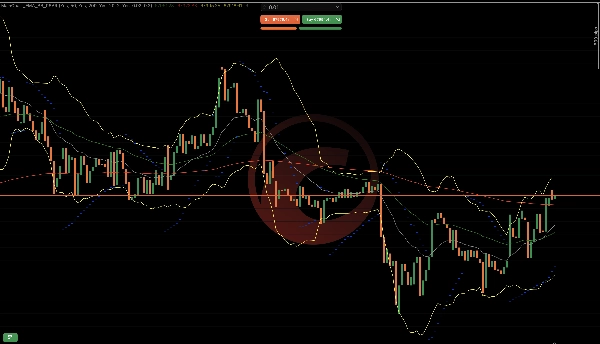
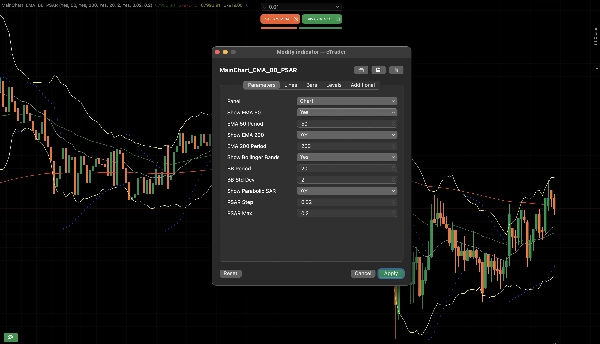
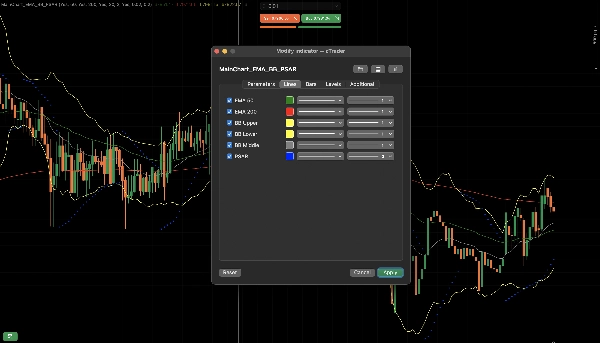
MainChart_EMA_BB_PSAR
Jak to działa
1. Podstawowa koncepcja
Ten wskaźnik łączy logikę trendu, zmienności i kontynuacji momentum w jedną nakładkę:
EMA 50 & EMA 200 → Kierunek trendu
Bollinger Bands → Zmienność i ekspansja
Parabolic SAR → Kontynuacja trendu i moment odwrócenia
Każdy element pełni określoną funkcję. Razem tworzą uporządkowane ramy decyzyjne.
2. Logika EMA (Silnik trendu)
Co robi
Oblicza wykładnicze średnie cen zamknięcia.
EMA 50 reaguje szybciej.
EMA 200 reaguje wolniej.
Jak interpretuje rynek
Znaczenie warunku
EMA 50 powyżej EMA 200 Trend wzrostowy
EMA 50 poniżej EMA 200 Trend spadkowy
EMA 50 przecina EMA 200 Możliwa zmiana trendu
Dlaczego to działa
EMA wygładza cenę i filtruje szumy.
Relacja 50/200 pokazuje krótkoterminowe momentum względem długoterminowego kierunku.
3. Logika Bollinger Bands (Silnik zmienności)
Co robi
Oblicza średnią kroczącą (środkowy pas)
Tworzy górne/dolne pasma za pomocą odchylenia standardowego
Jak interpretuje rynek
Znaczenie warunku
Pasma zwężone Niska zmienność (kompresja)
Pasma rozszerzone Wysoka zmienność (aktywne silne ruchy)
Cena dotyka zewnętrznego pasa Potencjalne przesadzenie ruchu
Dlaczego to działa
Rynki cyklicznie przechodzą między kompresją a ekspansją.
Wybicia często następują po skurczu zmienności.
4. Logika Parabolic SAR (Silnik kontynuacji)
Co robi
Rysuje kropki powyżej lub poniżej ceny.
Przyspiesza w miarę kontynuacji trendu.
Jak interpretuje rynek
Znaczenie pozycji kropki
Poniżej ceny Trend wzrostowy aktywny
Powyżej ceny Trend spadkowy aktywny
Zmiana pozycji kropki Możliwe odwrócenie
Dlaczego to działa
PSAR zacieśnia się w miarę dojrzewania trendu, pomagając śledzić ruchy i wykrywać wyczerpanie.
5. Jak wszystkie komponenty współpracują
Struktura wzrostowa
EMA 50 powyżej EMA 200
Cena powyżej EMA 50
PSAR poniżej świec
Bollinger Bands rozszerzające się w górę
→ Wskazuje na silne momentum wzrostowe
Struktura spadkowa
EMA 50 poniżej EMA 200
Cena poniżej EMA 50
PSAR powyżej świec
Bollinger Bands rozszerzające się w dół
→ Wskazuje na silne momentum spadkowe
6. Wykrywanie fazy rynku
Ten wskaźnik pomaga zidentyfikować 3 fazy rynku:
Faza trendu
EMA wyrównane
PSAR spójny
Pasma rozszerzające się
Najlepsze dla transakcji kontynuacyjnych.
Faza kompresji
Pasma ciasne
EMA płaska
PSAR często się zmienia
Najlepiej poczekać na wybicie.
Faza przejściowa
Tworzy się przecięcie EMA
Zmiana pozycji PSAR
Pasma rozszerzające się
Potencjalne wczesne odwrócenie.
7. Praktyczny przykład przebiegu
Przykładowa sekwencja wzrostowa:
Ścisk pasm
Silna świeca wzrostowa przebija górne pasmo
EMA 50 przecina się powyżej EMA 200
PSAR zmienia pozycję poniżej ceny
Ta sekwencja pokazuje:
Ekspansję zmienności
Potwierdzenie trendu
Wsparcie kontynuacji
8. Czego NIE robi
Nie przewiduje wiadomości
Nie gwarantuje odwróceń
Nie mierzy przepływu zleceń
Nie eliminuje fałszywych wybicia
Dostarcza uporządkowane potwierdzenie, nie pewność.
9. Podsumowanie modelu logiki
Filtr trendu → EMA
Wyzwalacz zmienności → Bollinger Bands
Czas i śledzenie → Parabolic SAR
Razem redukują losowe wejścia i poprawiają uporządkowane podejmowanie decyzji.
Dobrą cechą tego wskaźnika jest to, że jest konfigurowalny i nie ma potrzeby ustawiania wielu wskaźników.
Podsumowanie
1. Exponential Moving Averages (EMA 50 and EMA 200) to determine trend direction—EMA 50 reacts faster to price changes, while EMA 200 provides a longer-term trend perspective. The relative position of these EMAs signals bullish or bearish trends and potential trend shifts.
2. Bollinger Bands to measure market volatility and detect phases of compression (low volatility) and expansion (high volatility). Narrow bands indicate potential breakout setups, while price touching outer bands suggests possible overextension.
3. Parabolic SAR to identify trend continuation and reversal timing by plotting dots above or below price, signaling active uptrends or downtrends and potential reversals when dots flip position.
Together, these components form a structured decision framework that helps identify market phases—trending, compression, and transition—and supports confirmation of trend strength and momentum. The indicator is configurable and designed to reduce random entries by combining trend filtering, volatility triggers, and timing signals. It is applicable across various markets including Forex, cryptocurrencies, stocks, commodities, and indices. This tool provides structured confirmation for trading decisions but does not predict news events, guarantee reversals, or eliminate false breakouts.
Opinie klientów
5 | 50 % | |
4 | 50 % | |
3 | 0 % | |
2 | 0 % | |
1 | 0 % |


