
Opis
CO ROBI
Kanał Fibonacciego rozwiązuje problem, który większość narzędzi Fibonacciego ignoruje: gdzie umieszczasz kotwicę ma większe znaczenie niż jakie poziomy rysujesz.
Większość traderów stosuje zniesienia Fibonacciego ręcznie — wybierając lokalne maksimum i minimum, rysując narzędzie i mając nadzieję, że struktura się utrzyma. Efektem jest statyczne ujęcie, które staje się nieistotne w momencie, gdy cena przekracza którykolwiek z ekstremów.
Ten wskaźnik zmienia podejście.
Zamiast blokować się na stałym wahnięciu, Kanał Fibonacciego kotwiczy się w wybranym przez Ciebie punkcie i ciągle śledzi najwyższe maksimum i najniższe minimum od tej kotwicy do bieżącego słupka. W miarę rozszerzania się zakresu, kanał również się rozszerza. Poziomy Fibonacciego zawsze odzwierciedlają faktyczny rozwinięty zakres — a nie historyczne przypuszczenie.
Kanał rośnie wraz z rynkiem. Poziomy pozostają znaczące.
Kierunek jest śledzony automatycznie. W kontekście byczym poziomy mierzone są od góry w dół. W kontekście niedźwiedzim mierzone są od dołu do góry. Nie jest potrzebna ręczna korekta — wskaźnik odczytuje strukturę i odpowiednio się orientuje.
DLACZEGO FIBONACCI OPARTE NA KOTWICY?
Problem
Standardowe narzędzia Fibonacciego rysowane są między dwoma stałymi punktami. W momencie, gdy cena przekracza którykolwiek z ekstremów, narzędzie przestaje być ważne — trzeba je ręcznie przerysować. Tworzy to ciągły cykl korekt, a mapa Fibonacciego nigdy nie odzwierciedla dokładnie pełnego zakresu, który faktycznie się rozwinął.
Jest też głębszy problem: miejsce umieszczenia kotwicy definiuje wszystko. Dowolne umiejscowienie daje dowolne poziomy.
Rozwiązanie
Kanał Fibonacciego daje Ci świadomą kontrolę nad punktem kotwicy — a potem wszystko obsługuje automatycznie. Umieść kotwicę na słupku o znaczeniu strukturalnym (początek trendu, kluczowe odwrócenie, otwarcie sesji), a wskaźnik buduje pełny zakres do przodu od tego punktu. Każde nowe maksimum lub minimum rynku staje się częścią kanału. Poziomy Fibonacciego aktualizują się w czasie rzeczywistym.
Kotwica jest przeciągalna. Przesuń ją na wykresie, a cały kanał natychmiast się przerysuje.
Dlaczego wiele trybów?
Pełna siatka Fibonacciego nie zawsze jest tym, czego potrzebujesz. Czasem skupiasz się na strefie zniesienia między 38,2% a 61,8%. Czasem chcesz wyizolować strukturę tylko w górnej lub dolnej połowie zakresu.
Siedem odrębnych trybów kanału pozwala zastosować dokładnie taki poziom szczegółowości, jaki wymaga sytuacja — bez zaśmiecania wykresu poziomami, których nie używasz.
GŁÓWNA KONCEPCJA
Wskaźnik działa w jednym przejściu do przodu od kotwicy:
- Umieszczasz ikonę kotwicy na wybranym słupku
- Od tego słupka do przodu wskaźnik śledzi bieżące najwyższe maksimum i najniższe minimum
- Granice kanału (Linia Górna, Linia Dolna) odzwierciedlają ten rozszerzający się zakres
- Poziomy Fibonacciego są obliczane w zakresie, zorientowane według kierunku trendu
- Przesuń kotwicę — kanał przelicza się natychmiast
Kierunek trendu jest określany przez porównanie bieżącej ceny zamknięcia z ceną otwarcia słupka kotwicy. Byczy: poziomy mierzone od góry w dół od maksimum. Niedźwiedzi: poziomy mierzone od dołu do góry od minimum. Gdy kontekst kierunkowy rynku się zmienia, kanał automatycznie się orientuje.
Kotwica przyciąga się do czasów i cen otwarcia słupków dla czystego, powtarzalnego umiejscowienia.
TRYBY KANAŁU
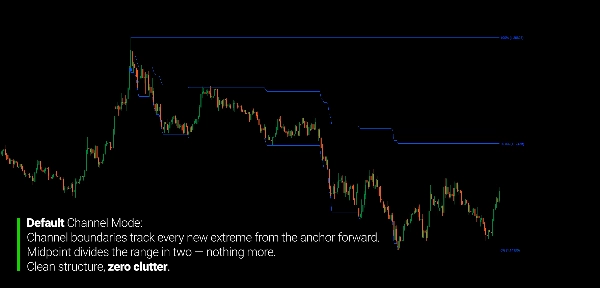
Domyślny Tylko Linia Górna, Linia Dolna i Linia Środkowa. Czysty widok granic zakresu bez poziomów wewnętrznych.
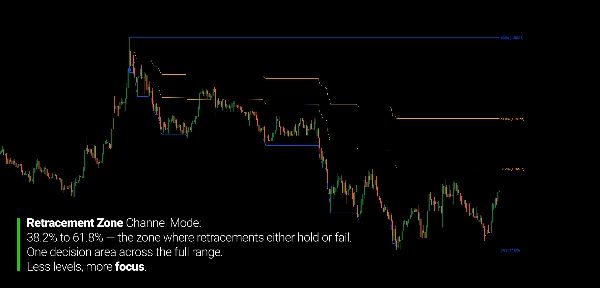
Strefa zniesienia Dodaje poziomy 61,8% i 38,2% — podstawową strefę zniesienia w pełnym zakresie. Najlepsze do identyfikacji głównego obszaru cofnięcia w ruchu.
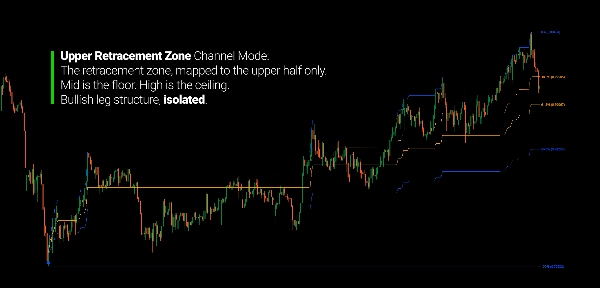
Górna strefa zniesienia Strefa zniesienia przypisana do górnej połowy kanału (między Środkową a Górną). Przydatna do izolowania struktury zniesienia w ruchu wzrostowym.
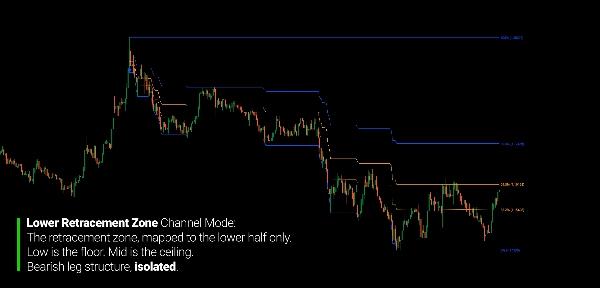
Dolna strefa zniesienia Strefa zniesienia przypisana do dolnej połowy (między Dolną a Środkową). Ta sama logika stosowana do ruchów spadkowych.
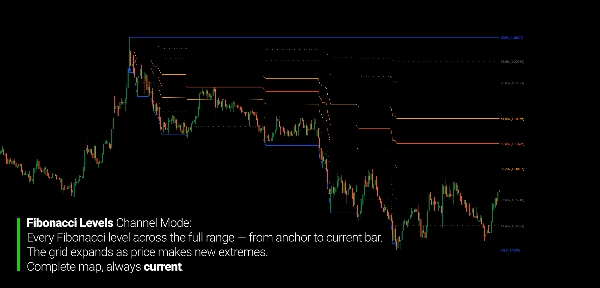
Poziomy Fibonacciego Pełna siatka Fibonacciego na całym zakresie: 88,6%, 78,6%, 61,8%, 50%, 38,2%, 23,6%, 11,4%. Dla traderów, którzy chcą pełnej mapy poziomów.
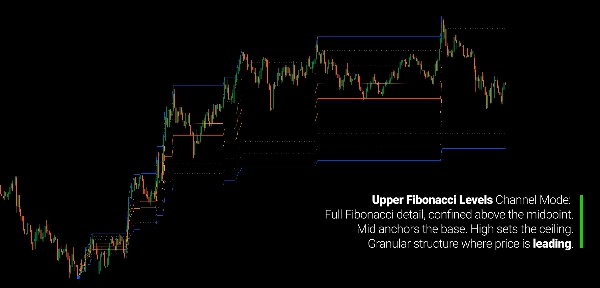
Górne poziomy Fibonacciego Pełna siatka Fibonacciego zastosowana tylko do górnej połowy kanału.
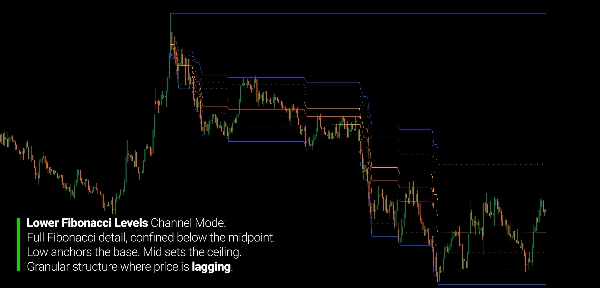
Dolne poziomy Fibonacciego Pełna siatka Fibonacciego zastosowana tylko do dolnej połowy kanału.
ODCZYTYWANIE WYKRESU
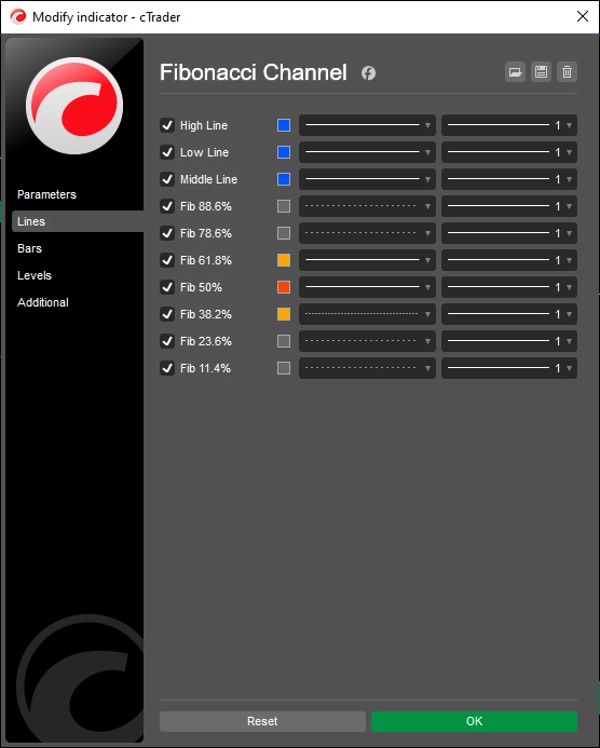
- Linia Górna: Górna granica kanału (najwyższe maksimum od kotwicy)
- Linia Dolna: Dolna granica kanału (najniższe minimum od kotwicy)
- Linia Środkowa: Punkt środkowy pełnego zakresu
- 61,8% / 38,2%: Podstawowa strefa zniesienia (pomarańczowe linie)
- 50%: Poziom środkowego zniesienia (czerwono-pomarańczowy)
- 78,6% / 88,6% / 23,6% / 11,4%: Rozszerzone poziomy Fibonacciego (szare kropkowane)
- Ikona kotwicy: Przeciągalna — przesuń ją, aby zdefiniować, gdzie kanał się zaczyna
Odniesienie kierunku:
- Kontekst byczy → poziomy orientowane od góry do dołu (Góra = 0%, Dół = 100%)
- Kontekst niedźwiedzi → poziomy orientowane od dołu do góry (Dół = 0%, Góra = 100%)
- Kierunek aktualizuje się automatycznie, gdy ostatnia cena zamknięcia przekracza otwarcie kotwicy
PARAMETRY
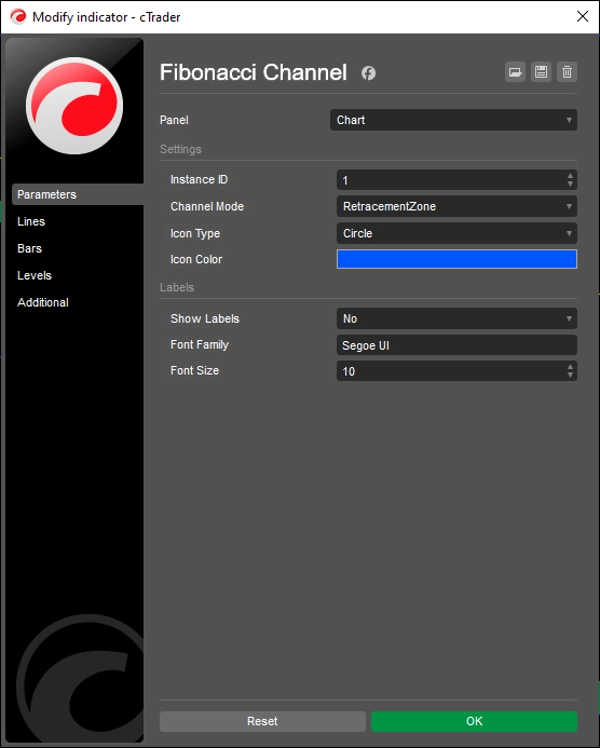
Ustawienia
- ID instancji — obsługuje wiele niezależnych kanałów na tym samym wykresie
- Tryb kanału — wybiera, które poziomy wyświetlać (7 trybów)
- Typ ikony — styl wizualny przeciągalnej kotwicy
- Kolor ikony — kolor markera kotwicy
Etykiety
- Pokaż etykiety — przełącz etykiety cen na każdym poziomie
- Rodzina czcionek — krój pisma etykiet
- Rozmiar czcionki — rozmiar etykiet (6–32)
DLA KOGO JEST TEN WSKAŹNIK
Ten wskaźnik jest dla traderów, którzy używają analizy Fibonacciego jako odniesienia strukturalnego, a nie jako mechanicznego narzędzia sygnałowego.
Jeśli spędziłeś czas na przerysowywaniu narzędzi Fibonacciego za każdym razem, gdy cena osiąga nowe ekstremum — lub zauważyłeś, że statyczne zniesienia przestają odzwierciedlać rynek po kilku słupkach — ten wskaźnik został stworzony właśnie po to.
Jest dobrze dopasowany do traderów swingowych i pozycyjnych, którzy chcą mapy Fibonacciego pozostającej ważną w miarę rozwoju ceny, traderów zakresu i struktury, którzy pracują z granicami kanału i strefami zniesienia jako odniesieniami wejścia lub wyjścia, oraz użytkowników wielu instancji, którzy chcą śledzić wiele niezależnych kanałów na tym samym instrumencie jednocześnie.
Przeciągalna kotwica czyni go praktycznym w użyciu na żywo: ustaw start kanału w punkcie istotnym strukturalnie i pozwól wskaźnikowi utrzymać mapę od tego momentu. Bez przerysowań, bez ręcznych aktualizacji.
To nie jest generator sygnałów. To strukturalne odniesienie dla traderów, którzy używają poziomów Fibonacciego jako kontekstu — a nie jako wyzwalaczy wejścia.
CO GO WYRÓŻNIA
Większość narzędzi Fibonacciego jest statyczna: dwa stałe punkty, jedna stała mapa. Ten jest dynamiczny — zakres rozszerza się wraz z rozwojem ceny, a poziomy zawsze odzwierciedlają faktyczny zakres od wybranej kotwicy do bieżącego słupka.
Większość implementacji Fibonacciego wymaga ręcznego ustawienia kierunku. Ten odczytuje kontekst byczy i niedźwiedzi automatycznie i odpowiednio orientuje wszystkie poziomy — bez żadnych zmian parametrów ze strony tradera.
Większość narzędzi kanałowych oferuje jeden układ. Ten oferuje siedem odrębnych trybów, od czystego widoku granic do pełnej siatki Fibonacciego zastosowanej do całego zakresu lub każdej połowy niezależnie. Wykres pokazuje dokładnie taki poziom szczegółowości, jaki potrzebujesz dla analizowanego kontekstu.
Wiele instancji może działać jednocześnie z niezależnymi kotwicami — każda śledzi inny segment strukturalny bez wzajemnych zakłóceń.
---
ZROZUMIENIE STRUKTURY FIBONACCIEGO
Stosunki Fibonacciego nie są predykcyjne. Opisują proporcjonalne relacje w ramach zakresów cenowych — relacje, które traderzy obserwują powtarzające się na rynkach i ramach czasowych od dziesięcioleci. Czy to odzwierciedla właściwości matematyczne rynków, czy po prostu zbiorowe zachowanie wokół dobrze znanych poziomów, pozostaje otwartym pytaniem. To, co ma znaczenie w praktyce, jest prostsze.
Kanał Fibonacciego definiuje zakres ruchu i dzieli go na proporcjonalnie znaczące strefy. Traderzy używają tych stref do oceny, czy cofnięcie jest płytkie czy głębokie, czy zniesienie się utrzymuje czy zawodzi, oraz czy cena zbliża się do obszaru, gdzie struktura historycznie była istotna.
Wartość podejścia opartego na kotwicy polega na tym, że utrzymuje analizę osadzoną w konkretnym zdarzeniu strukturalnym. Kanał nie zaczyna się w dowolnym punkcie — zaczyna się tam, gdzie zdecydujesz, że istotny ruch się rozpoczął. Ta decyzja należy do Ciebie na podstawie Twojej interpretacji wykresu. Rolą wskaźnika jest dokładne utrzymanie mapy od tego punktu do przodu, tak aby poziomy pozostawały ważne tak długo, jak struktura, którą mierzą, pozostaje nienaruszona.
---
Trading wiąże się z ryzykiem. Ten wskaźnik jest narzędziem analizy technicznej — zawsze stosuj odpowiednie zarządzanie ryzykiem.
Podsumowanie
Opinie klientów
5 | 100 % | |
4 | 0 % | |
3 | 0 % | |
2 | 0 % | |
1 | 0 % |


