Entdecken Sie die Geheimnisse der Marktstruktur mit dem ultimativen All-in-One-Volume-Profile- und Order-Flow-Analyse-Tool. Einmaliger Kauf, lebenslange Nutzung (keine monatlichen Abonnements erforderlich)
Volume Profile, Order Flow Imbalance & Liquidity Engine Indicator, ist nicht nur ein Standard-Histogramm; es ist eine umfassende Trading-Engine, die für ernsthafte Price-Action- und Volumen-Trader entwickelt wurde. Es kombiniert institutionelle Volume-Profile-Metriken (TPO und Volumen) mit fortschrittlichen Order-Flow-Algorithmen (OFI und OV), um Zonen mit hoher Wahrscheinlichkeit für Umkehrungen und Ausbrüche zu identifizieren.
Egal, ob Sie im H1-Chart scalpen oder tägliche Strukturen analysieren, dieser Indikator liefert den Kontext, den Sie benötigen, um mit dem „Smart Money“ zu handeln.
Hauptmerkmale
Fortgeschrittene Volume Profile & TPO Analyse
- Multi-Timeframe-Profile: Zeichnen Sie tägliche (D1) oder benutzerdefinierte Zeitrahmenprofile auf niedrigeren Zeitrahmen (z. B. Anzeige der täglichen Value Areas im H1-Chart).
- Point of Control (POC): Analyse des Preisniveaus mit der höchsten Volumenaktivität. Verfolgt die POC-Migration, um die Trendakzeptanz zu erkennen.
- Value Area (VA): Berechnet automatisch das Value Area High (VAH) und Value Area Low (VAL) basierend auf 70 % Volumenverteilung.
- Initial Balance (IB): Hebt den Eröffnungsbereich hervor (Standard 30 Minuten) und signalisiert Ausbrüche, was für Daytrader entscheidend ist.
Die „Engine“-Signale (Order Flow & Erschöpfung)
- OFI (Order Flow Imbalance): Erkennt aggressiven Kauf- oder Verkaufsdruck, der der Kursbewegung widerspricht oder einen Ausbruch bestätigt.
-
- Grüne Dreiecke/Text: OFI-Kaufsignal (aggressives Kaufen).
- Rote Dreiecke/Text: OFI-Verkaufssignal (aggressives Verkaufen).
- OV (Überbewertung/Volumenwarnung): Erkennt, wenn der Preis im Verhältnis zum Volumen überdehnt ist, visualisiert potenzielle Umkehrungen oder Erschöpfung.
-
- Orange Markierungen: OV-Warnung (Vorsichtszone).
- VP-Signale: Spezifische Signale für „In Value“ (Preis innerhalb der Value Area) und „VA Breakout“ (Preis verlässt die Value Area mit Momentum).
Liquidität & Tiefe
- Liquiditätstiefe: Signalisiert Liquiditätscluster oberhalb und unterhalb des aktuellen Preises, um potenzielle Unterstützungs-/Widerstandszonen zu identifizieren.
- Nackte POCs: Verfolgt ungetestete Point of Control-Niveaus aus vorherigen Sitzungen, die oft als Magneten für den Preis wirken.
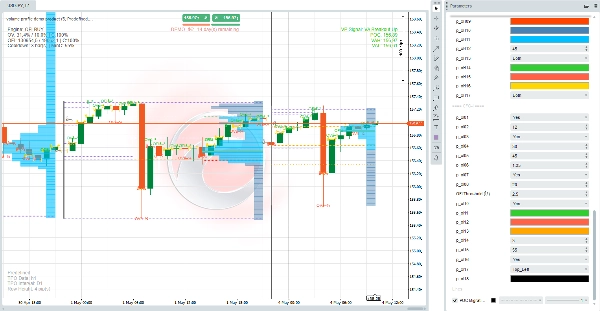
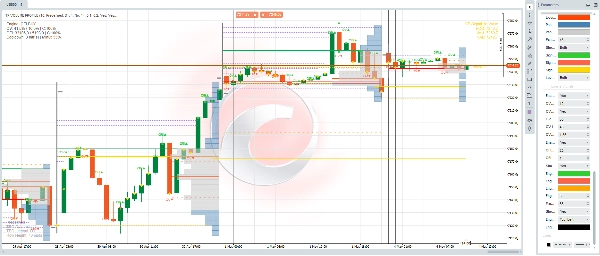
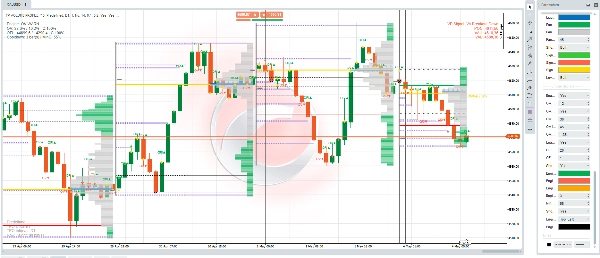
📊 Visueller Leitfaden
- Histogramme: Blaue und graue Balken rechts stellen die Volumenverteilung auf bestimmten Preisniveaus dar.
- Signalmarker:
-
- 🟢 Grüne Pfeile/Text: Kaufsignale (OFI Buy, VA Breakout Up).
- 🔴 Rote Pfeile/Text: Verkaufssignale (OFI Sell, VA Breakout Down).
- 🟡 Gelbe Linien: Grenzen der Value Area (VAH/VAL) oder Initial Balance-Niveaus.
- Info-Panel: Ein dediziertes Panel in der oberen linken Ecke zeigt Echtzeitstatistiken an:
-
- Aktueller Engine-Zustand (z. B. „OFI BUY“, „OV WARN“).
- Überbewertungsprozentsätze.
- OFI-Verhältnisse.
⚙️ Anpassung
Der Indikator ist über das Eingabefeld hochgradig konfigurierbar:
- Profileinstellungen: Passen Sie Lookback-Bars, Zeilenhöhe und Value-Area-Prozentsatz an.
- Engine-Einstellungen: Feinabstimmung der OFI- und OV-Empfindlichkeit (Sigma-Schwellenwerte, Lookback-Bars).
- Visuals: Ändern Sie Visuals für POC, VA, Signale und das Volumen-Panel, um Ihr Chart-Thema anzupassen.
💡 Für wen ist das?
- Daytrader: Nutzen Sie die Initial Balance und Daily Value Areas zur Planung Ihrer Sitzung.
- Scalper: Verwenden Sie OFI- und OV-Signale für präzise Einstiegssignale.
- Swing-Trader: Identifizieren Sie wichtige Unterstützungs-/Widerstandszonen über Naked POCs und Volumenknoten mit hohem Volumen.
Haftungsausschluss: Trading beinhaltet Risiken. Dieses Tool dient nur zu Analysezwecken und garantiert keine Gewinne. Testen Sie Strategien immer vor dem Live-Handel. Unauthorised
2026 DATARUM ALGORITHMICA. Alle Rechte vorbehalten.
- Geistiges Eigentum: Dieser Indikator, einschließlich aller Quellcodes, visuellen Designs, Algorithmen, Dokumentationen und Marken, ist das exklusive geistige Eigentum von DATARUM ALGORITHMICA. Unautorisierte Vervielfältigung, Verbreitung, Wiederverkauf oder Modifikation dieses Produkts ist strengstens untersagt.
- Keine Finanzberatung: DATARUM ALGORITHMICA entwickelt und stellt professionelle technische Analysewerkzeuge ausschließlich zu Bildungs- und Informationszwecken bereit. Nichts in diesem Produkt, seiner Dokumentation oder den zugehörigen Mitteilungen stellt eine Finanz-, Investitions-, Rechts- oder Steuerberatung dar. Nutzer sind allein verantwortlich für ihre Handelsentscheidungen.
- Risikohinweis – CFD- & Forex-Handel: Der Handel mit Contracts for Difference (CFDs), Forex und anderen gehebelten Finanzinstrumenten birgt ein hohes Risiko und ist möglicherweise nicht für alle Anleger geeignet. Sie könnten einen Teil oder Ihr gesamtes investiertes Kapital verlieren. Die vergangene Performance dieses Indikators ist kein Indikator für zukünftige Ergebnisse.
- Verantwortung des Nutzers: Durch den Kauf oder die Nutzung dieses Produkts bestätigen Sie, dass:
-
- Sie in Ihrer Gerichtsbarkeit volljährig sind und berechtigt, am Finanzhandel teilzunehmen.
- Sie die Risiken des gehebelten Handels verstehen.
- Sie die volle Verantwortung für Verluste, Schäden oder Konsequenzen übernehmen, die sich aus der Nutzung dieses Tools ergeben.
5 | 100 % | |
4 | 0 % | |
3 | 0 % | |
2 | 0 % | |
1 | 0 % |