
KasePeakOscillator
Wskaźnik
45 pobrania
Wersja 1.0, May 2026
Windows, Mac
5.0
Opinie: 1
Od 21/02/2025
466.3M
Wolumen transakcji
180.83K
Zysk w pipsach
22
Sprzedaż
6.87K
Bezpłatne instalacje
Opis
The KasePeakOscillator (KPO) to zaawansowane narzędzie analizy technicznej zaprojektowane do identyfikacji wyczerpania rynku, odwróceń trendów i zmian momentum. W przeciwieństwie do standardowych oscylatorów, KPO integruje statystyczne miary zmienności, aby dostarczać bardziej wiarygodne sygnały w zmiennych warunkach rynkowych.
Jak to działa: Wskaźnik oblicza zależność między ruchem cen a historyczną zmiennością (Średni Dzienne Zakres/Odchylenie Standardowe). Ocena "Krótkich Cyklów" względem "Długich Cyklów" pozwala określić, czy ruch cenowy jest statystycznie istotny, czy tylko szumem rynkowym. Wynikiem jest płynny, responsywny oscylator, który oscyluje wokół linii zerowej.
Kluczowe elementy:
- Histogram (KCD): Reprezentuje podstawowe momentum. Przekroczenie linii zerowej wskazuje na zmianę krótkoterminowego nastawienia trendu.
- Dynamiczne Pasma (Górne/Środkowe): Działają jako statystyczne progi "przekupienia" i "przesprzedania". Dostosowują się do zmienności rynku, rozszerzając się podczas okresów wysokiej aktywności i kurcząc podczas konsolidacji.
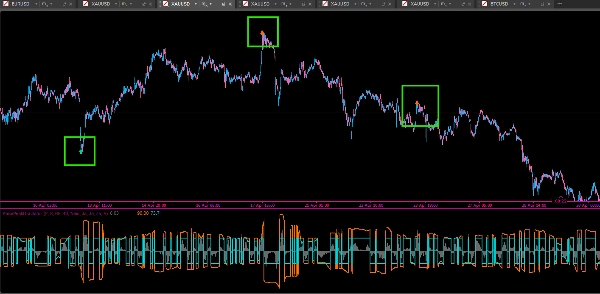
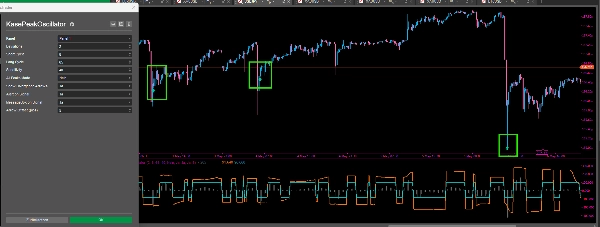
- Automatyczne wykrywanie szczytów: Wskaźnik identyfikuje "Szczyty" i "Dołki", gdzie momentum osiąga statystyczny ekstremum, sygnalizując potencjalne wyczerpanie.
Strategia handlowa:
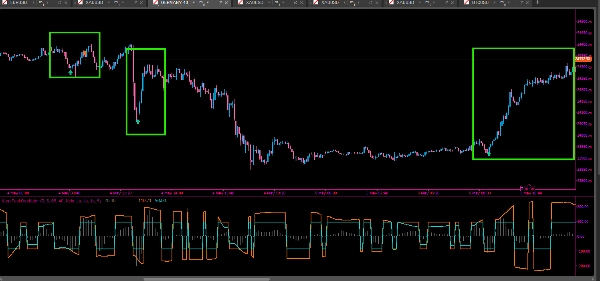
- Wyczerpanie szczytu: Gdy szczyt momentum występuje poza dynamicznymi pasmami (wskazywany przez miętowe lub pomarańczowe strzałki), sugeruje to, że obecny trend jest nadmiernie rozciągnięty i prawdopodobne jest odwrócenie lub korekta.
- Sygnały dywergencji: KPO automatycznie identyfikuje bycze i niedźwiedzie dywergencje. Dywergencja występuje, gdy cena osiąga nowy ekstremum, ale oscylator tego nie robi, co wskazuje na osłabienie momentum. Są one oznaczone ikonami Jasnoniebieskimi (bycze) oraz Złotymi (niedźwiedzie).
- Potwierdzenie trendu: Użyj pozycji Histogramu względem linii zerowej, aby potwierdzić kierunek trendu. Pozostawanie powyżej zera wspiera pozycje długie, podczas gdy pozostawanie poniżej zera wspiera pozycje krótkie.
Funkcje:
- Zintegrowany system alertów (dźwięk, okno wiadomości i ikony wizualne).
- Regulowana czułość, aby dopasować się do różnych klas aktywów (Forex, indeksy, kryptowaluty).
- Tryb "Wszystkie szczyty" do agresywnego skalpowania lub tryb filtrowany do wysokoprawdopodobnych ustawień swingowych.
Podsumowanie
Podsumowanie AI
The KasePeakOscillator (KPO) is a technical indicator designed to detect market exhaustion, trend reversals, and momentum shifts by integrating price action with statistical volatility measures. It calculates the relationship between short-term and long-term price cycles adjusted for historical volatility, producing a smooth oscillator around a zero line.
Key components include:
- Histogram (KCD): Represents core momentum; zero-line crossings indicate short-term trend changes.
- Dynamic Bands: Volatility-adjusted thresholds signaling overbought or oversold conditions.
- Automated Peak Detection: Identifies momentum extremes signaling potential trend exhaustion.
The KPO provides automated alerts for peak exhaustion and divergence signals, marking bullish and bearish divergences when price and momentum disagree. Trend direction can be confirmed by the histogram’s position relative to zero.
Features include adjustable sensitivity for various asset classes such as Forex, indices, and cryptocurrencies, an integrated alert system (sound, message, visual icons), and modes tailored for scalping or swing trading. The indicator supports analysis based on price bars and outputs reversal and divergence signals to assist in trading decisions.
Profil wskaźnika
Kategoria wskaźnika
Dynamika
Typ wyjścia
Sygnały
Wymagania dotyczące danych
Tylko słupki
Obsługiwane sygnały
Odwrócenie trendu
Dywergencja
Opinie klientów
5.0
Opinie: 1
5 | 100 % | |
4 | 0 % | |
3 | 0 % | |
2 | 0 % | |
1 | 0 % |
Opinie klientów
May 27, 2026
Reliable tool with a learning curve This indicator takes a little time to get used to, but once you understand how to read the signals properly it delivers solid results. Works best when combined with support and resistance levels and a clear market structure.
Dyskusja
Częste pytania
Key Levels
Volume
Produkty dostępne za pośrednictwem cTrader Store, w tym boty handlowe, wskaźniki i wtyczki, dostarczane są przez deweloperów zewnętrznych i udostępniane wyłącznie w celach informacyjnych oraz w celu zapewnienia dostępu technicznego. cTrader Store nie jest brokerem i nie zapewnia doradztwa inwestycyjnego, nie udziela spersonalizowanych rekomendacji ani nie gwarantuje przyszłych wyników.


![Logo „[Stellar Strategies] Visual Trend Momentum”](https://cdn.ctrader.com/image/webp/48aee0a5-f10e-4bc8-9671-78e156fcc5df_27548)


Cena
Od 21/02/2025
466.3M
Wolumen transakcji
180.83K
Zysk w pipsach
22
Sprzedaż
6.87K
Bezpłatne instalacje