Beschreibung
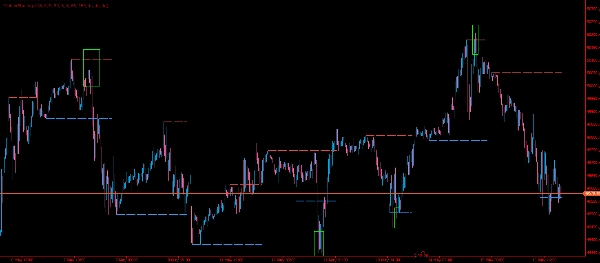
Die Globex Trap Strategie bildet die Spanne der Overnight-Session ab (Standard 18:00–09:30 ET), indem sie das höchste Hoch und das niedrigste Tief verfolgt, die vor der Eröffnung in New York gebildet wurden. Sobald die NY-Session beginnt, wird nach einem Sweep gesucht – einem Docht, der das Globex-Hoch oder -Tief durchstößt, aber wieder innerhalb der Spanne schließt, was auf einen Liquiditätsgriff gegen ruhende Stopps hinweist. Nachdem ein Sweep bestätigt wurde, durchsucht sie jede geschlossene Kerze nach Angebotszonen oberhalb des Globex-Hochs oder Nachfragezonen unterhalb des Globex-Tiefs, die auf einer klassischen Rally-Base-Drop- oder Drop-Base-Rally-Struktur basieren.
Wie man es benutzt:
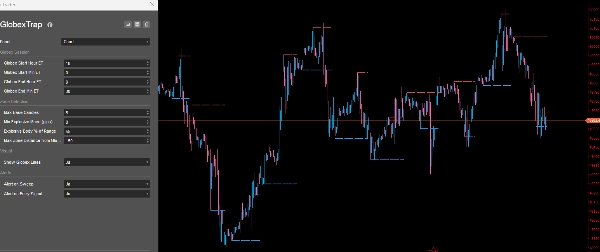
Anwenden auf ein 1- oder 5-Minuten-Chart bei jedem Instrument mit bedeutender Overnight-Aktivität – Index, Forex-Majors, Metalle wie Gold und Silber oder Rohstoffe. Lassen Sie die Overnight-Session bis 09:30 ET laufen – der Indikator baut die Spanne automatisch auf. Sobald die NY-Session eröffnet, beobachten Sie die Globex-Hoch- und Tief-Linien im Chart. Ein kleiner Pfeil markiert jede Kerze, bei der ein Sweep dieser Niveaus stattgefunden hat, was bestätigt, dass Liquidität genommen wurde. Ab diesem Zeitpunkt überwachen Sie die Angebotszonen oberhalb des Globex-Hochs und die Nachfragezonen unterhalb des Globex-Tiefs, die der Indikator identifiziert hat. Verkaufen Sie an Angebotszonen nach einem Globex-Hoch-Sweep und kaufen Sie an Nachfragezonen nach einem Globex-Tief-Sweep. Verwenden Sie Ihre eigenen Kriterien für das Trade-Management. Vermeiden Sie Setups, die nach 13:00 ET entstehen, da die Teilnahme typischerweise abnimmt.


