

Opis
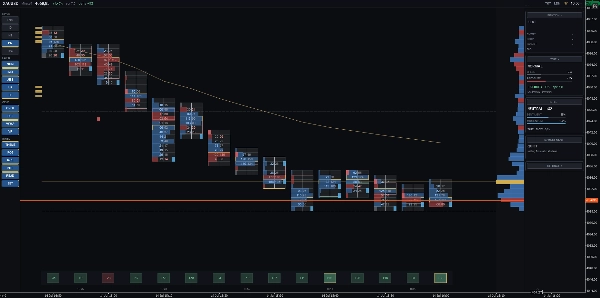
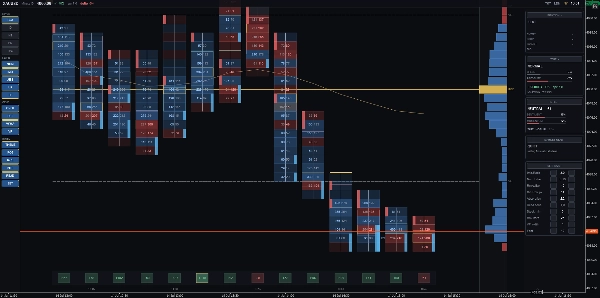
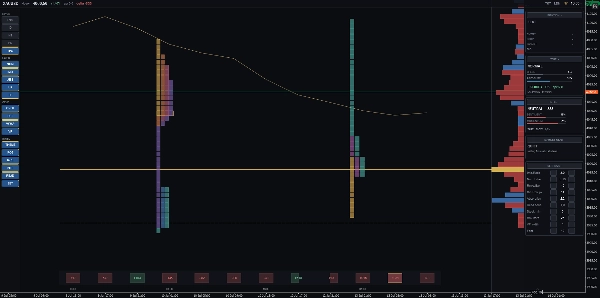
DRX OrderFlux przekształca dane tick w czysty wykres przepływu zleceń, pokazując, gdzie momentum ustaje i które poziomy aukcji są wielokrotnie testowane. CO RYSUJE - Ślad Bid x Ask: Podzielony na poziomy cenowe z aktywnością kupna i sprzedaży obok siebie. Pięć widoków: Bid x Ask, Delta, Heatmapa, Profil i TPO. - Nierównowagi i nałożone ściany: Podkreśla poziomy cen, gdzie nierównowaga wolumenu przekracza wybrany przez Ciebie współczynnik. - Absorpcja i nieukończone aukcje: Wykrywa wysoką aktywność, która nie przesuwa ceny dalej, oraz ekstremalne poziomy zamykające niekompletne transakcje. - Pojedyncze wydruki: Podkreśla poziomy cen odwiedzane krótko przed szybkim odrzuceniem. - Profil wolumenu: Wyświetlany w panelu przypiętym do prawej krawędzi z POC, VAH, VAL i sesyjnym VWAP. - Bloki czasowe TPO: Jeden profil na sesję z dedykowanym POC, kodowany kolorystycznie chronologicznie. - Pasmo delty: Umieszczone na dole w jednej linii dla bezpośredniego porównania. - Odczyt rynku: Dyskretne sygnały pojawiające się podczas wyraźnych odrzuceń lub wybicia wolumenu. Progi kalibrują się automatycznie dla każdego symbolu. - Panel taśmy: Mierzy aktualną prędkość taśmy względem średnich poziomów i dostarcza ostrzeżenia o płynności. - Panel pozycji: Wyświetla wejście, stop, cel, PnL oraz stosunek ryzyka do zysku z wyraźnymi liniami na wykresie. Ustawienia układu są zapisywane automatycznie dla każdego symbolu i interwału czasowego. JAK UŻYWAĆ Kompatybilny ze wszystkimi symbolami i interwałami czasowymi. Idealny do analizy intraday (M1 do H1). Działa razem z DRX Footprint Lower dla dedykowanych paneli wolumenu, delty i skumulowanej delty. O DANYCH Dane tick cTrader zawierają czas, oferty bid i ask, ale nie przesyłają danych o wielkości transakcji. DRX OrderFlux mierzy aktywność ticków, a nie wolumen kontraktów, stosując standardową metodologię wolumenu ticków FX. Dane Depth of Market opierają się na źródłach brokera. Większość kont CFD oferuje ograniczone poziomy zagregowane; dlatego ostrzeżenia o płynności są zintegrowane z panelem taśmy, a nie z drabiną księgi zleceń.
Podsumowanie
Key features include five distinct views: Bid x Ask footprint, Delta, Heatmap, Volume Profile, and TPO (Time Price Opportunity). The indicator highlights imbalances and stacked walls where one side dominates, absorption zones where heavy activity fails to move price, unfinished auctions, and single prints—levels touched only once. The volume profile panel shows POC (Point of Control), VAH (Value Area High), VAL (Value Area Low), and session VWAP. TPO profiles per session are color-coded to compare auction shapes across days.
Additional tools include a delta lane for comparing bars, a market read panel that signals price rejections or breaks with volume and delta confirmation, a tape panel showing tape speed and liquidity warnings, and a position panel displaying entry, stop, target, PnL, pips, and risk-reward ratio. Layouts are saved per symbol and timeframe for consistent workspace setup.
DRXFootprint uses cTrader tick data, measuring tick activity rather than traded contract volume, and includes liquidity warnings based on broker depth of market data.
Opinie klientów
Dyskusja
Częste pytania

















Cena
