

present
Registrati e ricevi uno sconto da $50 sul tuo primo acquisto
Trading product for Regime Compass Indicatore EMA, image 1
Regime Compass
Indicatore
Versione 1.0, Aug 2026
Windows, Mac
Trading product for Regime Compass Indicatore EMA, image 2
Trading product for Regime Compass Indicatore EMA, image 3
Trading product for Regime Compass Indicatore EMA, image 4
Da 15/08/2026

Descrizione

WHAT IT DRAWS


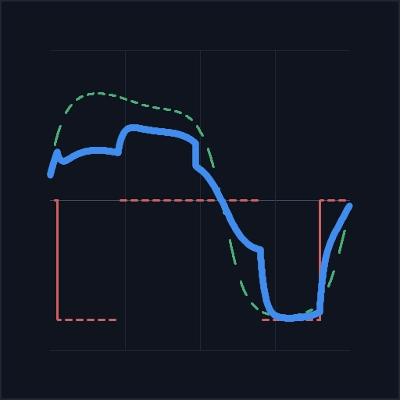
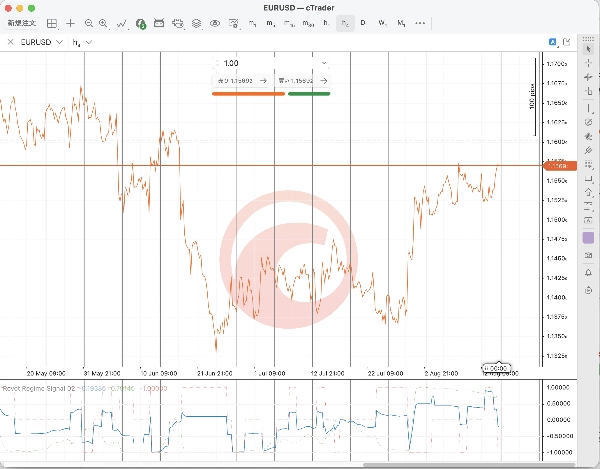
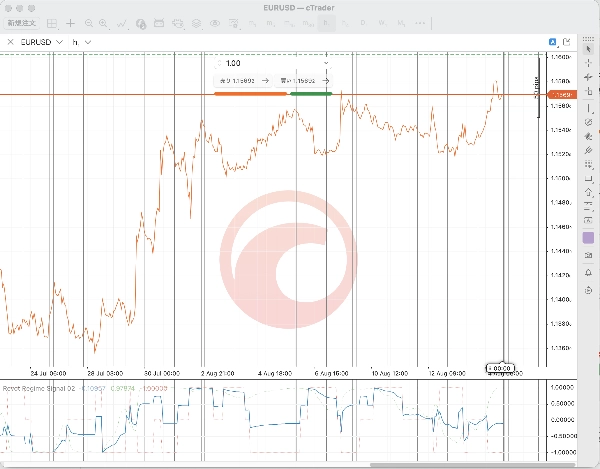
Three lines in a sub-panel below your chart.


Blended signal, blue and solid. The combined value, held between minus one and plus one.


Trend component, green and dotted. The trend half on its own.


Reversion component, red and dotted. The mean-reversion half on its own.


Seeing the two halves separately is the point. When they disagree, the blend sits near zero and you can see which side is pulling.


HOW IT IS COMPUTED


The trend half takes the ratio of a fast EMA to a slow EMA, minus one. That relative distance is standardised over its own history, bounded, and passed through tanh, so the line scales with how unusual the current separation is instead of flipping on every crossover.


The reversion half is a z-score of close over a fixed lookback. The state turns one way when the z-score reaches the entry level, the other way at the mirror level, and flattens once the z-score falls back inside the exit band. It holds its previous state in between, which is why the red line moves in steps rather than continuously.


The weighting compares short-window return volatility against long-window return volatility. When the short window runs hot relative to the long window, the blend leans towards the trend half. Otherwise it leans towards the reversion half. Follow the market when it is moving, fade it when it is quiet.


DECISION TIMING


Everything is computed on completed bars only. The forming bar is never drawn, so a value you have already seen does not change afterwards. The reversion state advances exactly once per closed bar, so a chart recalculation replays the same history rather than double-counting it.


WHAT IT DOES NOT DO


It places, modifies, cancels and closes no orders. It reads only the chart symbol's own bars. No network access, no file access, no external data feed.


It is a display. It does not forecast, and every trading decision stays yours.


PARAMETERS


The trend periods, the reversion lookback, the entry and exit levels, the two volatility windows and the weighting are fixed in this build. The line you see is one specific configuration rather than a surface you tune until it looks right.


SCOPE


This indicator was developed and checked on one instrument over one historical window. That says nothing about how it behaves on another symbol, another timeframe or another period. Run it on a demo account, on the instruments you actually trade, and decide for yourself whether the behaviour suits you.


Trading carries risk of loss.


SUPPORT


Questions answered within 3 business days. Version history published with every change.


Riepilogo

Profilo indicatore
Categoria indicatore
Trend
Tipo di output
Visualizzazione
Requisiti per i dati
Solo barre
Segnali supportati
Forza del trend
Inversione
Volatilità

Recensioni dei clienti

0.0
Recensioni: 0
Recensioni dei clienti
Questo prodotto non ha ancora ricevuto recensioni. L'hai già provato? Fallo sapere agli altri per primo!

Discussioni

Domande frequenti

EMA
I prodotti disponibili tramite cTrader Store, inclusi bot di trading, indicatori e plugin, sono forniti da sviluppatori terzi e resi disponibili esclusivamente a scopo informativo e di accesso tecnico. cTrader Store non è un broker e non fornisce consulenze in materia di investimento, raccomandazioni individualizzate o garanzie di risultati futuri.

Potrebbe interessarti anche

Indicatore
Track VWAP for Asia, London, NY, Sydney, Daily, Weekly, Monthly & Custom Sessions. Perfect for FX & intraday trading!
Indicatore
Prop
Institution-level trend Analyzer.
Indicatore
Order Block
Supply & Demand
+2
Professional MTF dashboard aggregating and clustering Supply & Demand zones from multiple timeframes in cTrader.
Indicatore
ATR
Fibonacci
+1
Trading Clock Pro: An all-in-one market timing dashboard designed to help traders understand the market at one Spot.
Indicatore
ATR
EMA
+3
High-Tech 3-Level Squeeze Detection with HTF Filter, Carter Entry/Exit Rules, Signal Quality Grading & Real-Time
Indicatore
Prop
Forex
+13
"Footprint Chart: Visualize bid-ask volume inside candles for clearer order flow and market depth insights."
Indicatore
ADX
ATR
+5
Designed exclusively for trading the Gold market (XAUUSD), GoldMasterIndicator provides institutional-grade technical!
Indicatore
ADX
ATR
+5
📊 3D ICT Order Blocks with ML probabilities, smart detection & bullish/bearish zones for precision trading setups now.
Indicatore
VWAP
Fibonacci
+5
Market Blueprint - SMC/ICT One Indicator. Eleven Core Module, Single Chart , MTF candles, MTF FVG
Indicatore
ATR
RSI
+5
One of the best indicators we have ever developed, with a very high profit ratio.
Indicatore
Forex
Crypto
+5
This indicator combines two independent analytical engines into a single overlay on your chart.
Indicatore
AI
Prop
+16
Pro trading dashboard: WVAP analysis + Volume Profile + Neural AI tracking + News alerts. All-in-one tool!
Indicatore
ATR
Signal
One of the best indicators we have ever developed, with a very high profit ratio.
Logo di "BvsB 2026"
Più votato
4.7
(4)
Indicatore
Prop
Forex
+1
Smart support/resistance indicator with rejection-only Buy/Sell signals designed for H1 charts.
Indicatore
Forex
EURUSD
+4
This is a tool to help traders open orders/close orders/modify orders quickly with just one click.
Indicatore
Forex
Crypto
+5
Volume Imbalance Bars Indicator - brings institutional-grade market microstructure analysis to cTrader.
Indicatore
Volume
Key Levels
+2
Professional Session Volume Profile for cTrader with POC, Value Area, naked levels and rich HUD.
Indicatore
ATR
SMC
+5
CISD Projections with MTF panel: detects market shifts, auto targets, and clear real-time buy/sell signals.

Prezzo

Da 15/08/2026
















