
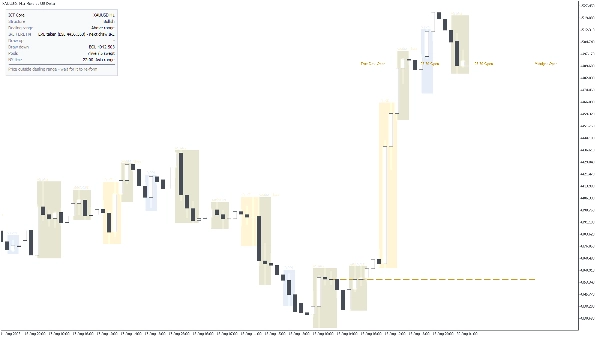
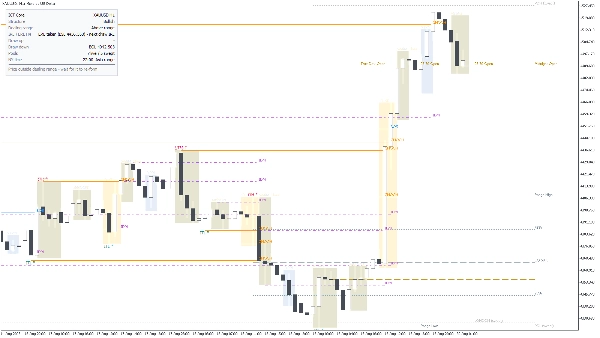
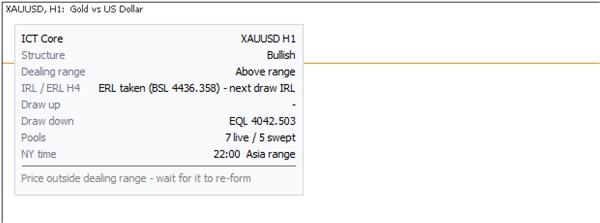
Penerangan
ICT Core mengubah carta harga mentah menjadi bacaan Konsep Wang Pintar (ICT) yang tersusun: struktur pasaran, kolam kecairan, julat urus niaga, keadaan IRL / ERL, sesi New York dan zon pembunuh, serta panel yang menyatakan bias semasa dan pelan bersyarat dalam bahasa Inggeris yang mudah. Ia hanya menarik dari tindakan harga yang telah ditutup dan disahkan - setelah tahap atau label dicetak, ia kekal di tempatnya.
APA YANG DIANALISIS
ICT Core membaca data bar (buka / tinggi / rendah / tutup) dari simbol carta, serta satu jangka masa lebih tinggi pilihan anda (lalai H4) untuk bacaan IRL / ERL. ATR digunakan untuk mengukur saiz ayunan, jarak label dan toleransi tinggi sama / rendah sama, jadi tetapan yang sama berfungsi dengan konsisten pada XAUUSD, indeks dan FX. Masa sesi dan zon pembunuh dikira dalam waktu New York dengan pengendalian DST automatik, bukan dalam jam broker tetap.
APA YANG DILUKIS DAN CARA MEMBACA
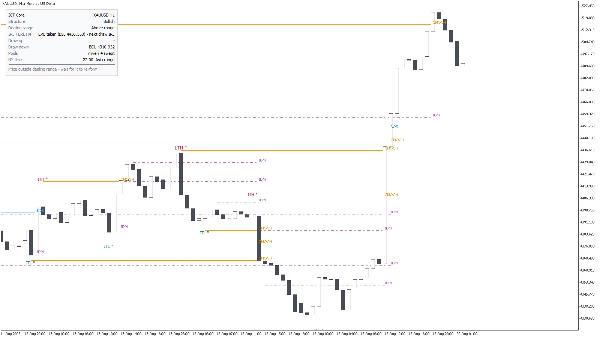
- Struktur pasaran. Ayunan diklasifikasikan sebagai jangka pendek, jangka sederhana dan jangka panjang. Pecahan dilabelkan BOS (sambungan) atau CHOCH (perubahan watak); pecahan yang dibuat hanya oleh sumbu ditandai secara berasingan sebagai sapuan, supaya anda dapat membezakan perpindahan sebenar dari serangan. Tinggi dan rendah yang diambil oleh kaki impulsif ditandai kuat / lemah.
- Induksi (IDM). Tinggi atau rendah kecil yang kemungkinan harga akan bergerak sebelum pergerakan sebenar ditandakan, supaya anda dapat melihat perangkap sebelum ia dipasang.
- Kolam kecairan. Hari sebelumnya, minggu sebelumnya, bulan sebelumnya, tinggi dan rendah sesi, serta tinggi sama / rendah sama dilukis sebagai tahap sisi beli (BSL) dan sisi jual (SSL). Setelah kolam disapu, ia diredamkan dan bukan dipadamkan, supaya sejarah apa yang telah diambil kekal boleh dibaca.
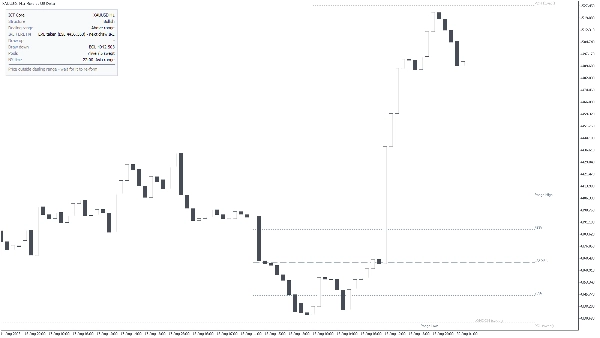
- Julat urus niaga. Julat aktif antara tinggi dan rendah sah terakhir, dengan kuadran 25% / 75% pilihan untuk rujukan premium / diskaun.
- IRL / ERL. Panel menyatakan sama ada kecairan luaran telah diambil dan lukisan seterusnya adalah dalaman, atau sebaliknya, dibaca dari jangka masa lebih tinggi yang anda pilih.
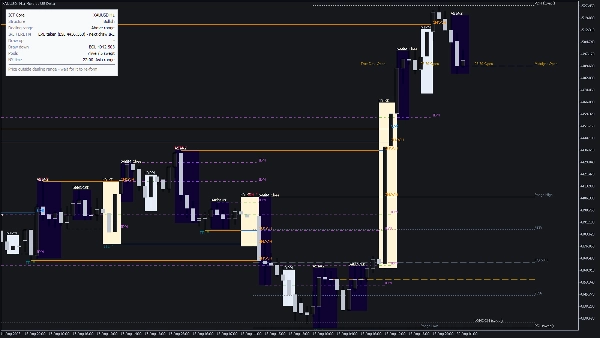
- Sesi dan masa. Kotak Asia, London, NY AM dan NY PM; zon pembunuh London, New York dan penutupan London; tingkap peluru perak; makro 20 minit pilihan; dan garis harga pembukaan sesi.
- Panel maklumat. Simbol dan jangka masa, bias struktur, lokasi harga dalam julat urus niaga, keadaan IRL / ERL, lukisan terdekat di atas dan bawah dengan harganya, berapa banyak kolam yang aktif berbanding disapu, waktu New York dan sesi aktif - serta baris pelan bersyarat seperti "Harga di luar julat urus niaga - tunggu ia terbentuk semula".
- Amaran. Popup, bunyi atau e-mel pada sapuan kolam, pada BOS / CHOCH, dan pada pembukaan zon pembunuh.
TETAPAN UTAMA
- Umum: tema carta (auto / terang / gelap), bar untuk dianalisis (lalai 1500), saiz fon label, dan jarak label disusun (dalam ATR).
- Struktur pasaran: kekuatan ayunan dalam bar setiap sisi (lalai 2), tier ayunan yang hendak ditunjukkan, BOS / CHOCH hidup atau mati, pecahan hanya sumbu hidup atau mati, induksi hidup atau mati, dan saiz impuls dalam ATR yang melayakkan tinggi atau rendah sebagai kuat (lalai 1.0).
- Kolam kecairan: kolam mana yang hendak dilukis, toleransi tinggi sama / rendah sama dalam ATR (lalai 0.15), berapa hari sebelum kolam tamat tempoh (lalai 20), dan sama ada kolam yang disapu kekal kelihatan.
- Julat urus niaga: julat hidup atau mati, kuadran 25% / 75% hidup atau mati.
- IRL / ERL: jangka masa sumber (lalai H4) dan berapa banyak barnya untuk diimbas (lalai 300).
- Sesi: kotak sesi, zon pembunuh, peluru perak, makro, harga pembukaan, berapa hari ke belakang untuk dilukis (lalai 5), dan kelegapan isi kotak.
- Panel: sudut, offset X / Y, saiz fon, sama ada untuk menunjukkan baris pelan, berapa banyak bar sapuan masih dikira sebagai baru (lalai 12), dan sama ada pelan memerlukan zon pembunuh aktif.
- Amaran dan set warna penuh untuk setiap elemen pada carta.
PENGGUNAAN TIPIKAL
1. Tambah ICT Core ke carta M5 - H1 XAUUSD, indeks atau pasangan FX utama.
2. Baca panel dari atas ke bawah: bias, lokasi dalam julat urus niaga, IRL / ERL, dan lukisan terdekat di atas dan bawah.
3. Tunggu kolam kecairan disapu dalam zon pembunuh, kemudian cari CHOCH bertentangan dengan sapuan pada jangka masa kemasukan anda.
4. Gunakan lukisan bertentangan yang ditunjukkan dalam panel sebagai sasaran, dan ekstrem yang disapu sebagai pembatalan.
5. Hidupkan amaran sapuan dan BOS / CHOCH jika anda tidak mahu memerhati carta sepanjang sesi.
SIAPA YANG SESUAI
Pedagang yang sudah bekerja dengan ICT / Konsep Wang Pintar dan mahu lapisan struktur, kecairan dan masa pada satu carta daripada melukisnya secara manual setiap hari. Ia ditujukan kepada pedagang diskresionari intrahari dan ayunan pendek. Ia bukan alat anak panah beli / jual untuk pemula - anda perlu tahu apa maksud BOS, CHOCH, IDM, IRL dan ERL untuk menggunakannya.
PENDEKATAN DAN NOTA PENGGUNAAN PENTING
- ICT Core adalah alat analisis dan visualisasi. Ia tidak membuat pesanan, tidak memberikan isyarat beli / jual, dan baris pelan adalah peringatan bersyarat, bukan cadangan.
- Segalanya berasal dari ayunan yang disahkan, jadi titik struktur muncul hanya selepas bilangan bar yang diperlukan telah ditutup di setiap sisi (lalai 2). Tiada apa yang dilukis semula selepas itu.
- Masa sesi dan zon pembunuh mengikuti waktu New York termasuk DST. Carta anda dipaparkan dalam waktu pelayan broker, jadi kotak tidak akan sejajar dengan offset UTC tetap - ini adalah disengajakan.
- Bacaan IRL / ERL jangka masa lebih tinggi memerlukan sejarah yang cukup pada jangka masa itu; pada simbol dengan sejarah pendek ia dipaparkan sebagai tidak tersedia.
- Analisis terhad kepada tetingkap bar untuk dianalisis (lalai 1500). Tingkatkan untuk lebih sejarah, dengan kos lukisan pertama yang lebih berat.
- Berjalan pada cTrader Desktop untuk Windows dan Mac. Penunjuk tersuai tidak tersedia pada mudah alih atau web.
- Perdagangan melibatkan risiko. Tingkah laku masa lalu mana-mana corak tidak menjamin hasil masa depan. Sentiasa gunakan pengurusan risiko anda sendiri.
Ringkasan
ICT Core highlights liquidity pools from previous days, weeks, months, and sessions, showing buy-side and sell-side levels, and dims swept pools to maintain historical context. It also delineates session times and killzones based on New York time with automatic daylight saving adjustments. An info panel provides a summary of current bias, price position within the dealing range, IRL/ERL status, nearest levels, live versus swept pools, and a conditional trading plan in plain English.
Users can customize settings including chart theme, swing parameters, liquidity pool visibility, session displays, and alert notifications for pool sweeps, BOS/CHOCH events, and killzone openings. ICT Core is intended for traders familiar with ICT/SMC concepts seeking an integrated, structured view of market dynamics for intraday and short-swing discretionary trading.

















