present
Zarejestruj się i otrzymaj 50 $ zniżki na pierwszy zakup
Trading product for MACD Candles and Arrows - Muravha Wskaźnik MACD, image 1
MACD Candles and Arrows - Muravha
Wskaźnik
Wersja 1.0, Aug 2026
Windows, Mac
Trading product for MACD Candles and Arrows - Muravha Wskaźnik MACD, image 2
Trading product for MACD Candles and Arrows - Muravha Wskaźnik MACD, image 3
Trading product for MACD Candles and Arrows - Muravha Wskaźnik MACD, image 4
Trading product for MACD Candles and Arrows - Muravha Wskaźnik MACD, image 5
Trading product for MACD Candles and Arrows - Muravha Wskaźnik MACD, image 6
4.14M
Wolumen transakcji
38.59K
Zysk w pipsach
1
Sprzedaż

Opis

Świece i Strzałki MACD

Przegląd

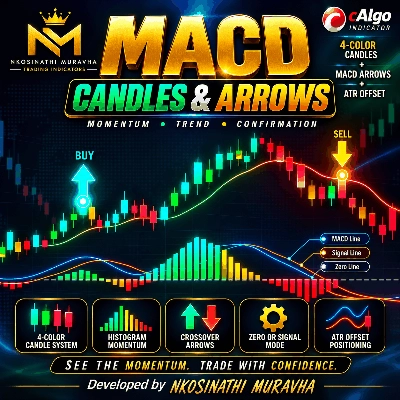
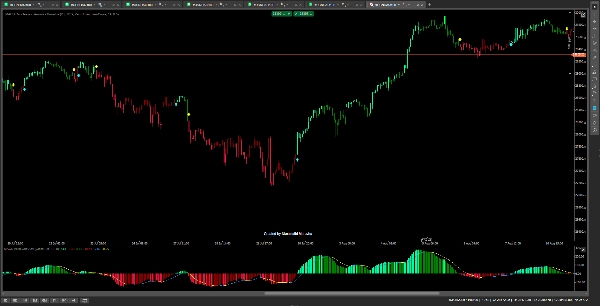
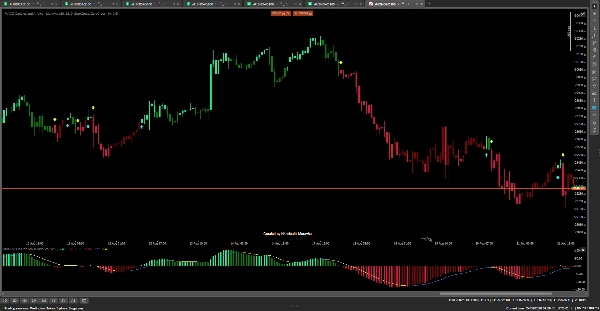
Świece i Strzałki MACD to wskaźnik momentum i potwierdzenia trendu, zaprojektowany, aby pomóc traderom szybko identyfikować zmiany w momentum byków i niedźwiedzi bezpośrednio na wykresie cenowym.

Łączy analizę histogramu MACD, przecięcia linii sygnału MACD, klasyfikację kolorów świec oraz strzałki kierunkowe w jedno wizualne narzędzie handlowe.


Jak działa wskaźnik

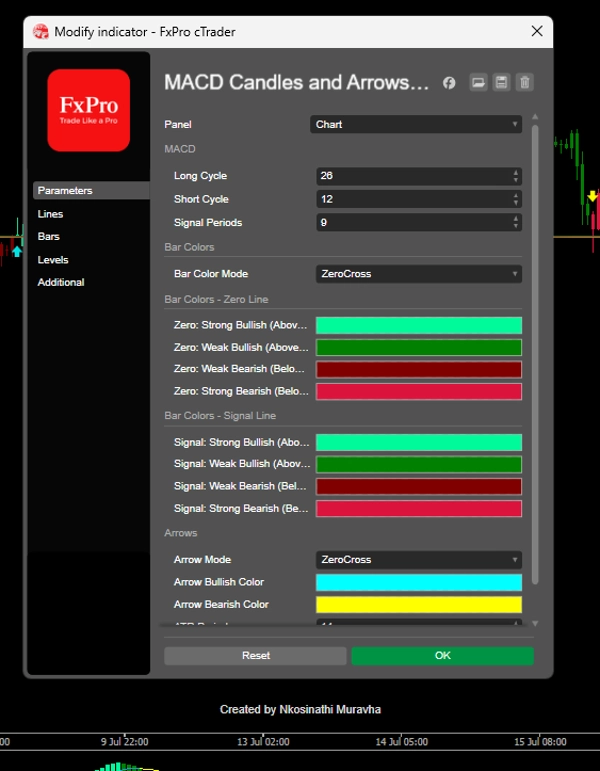
1. System kolorów świec

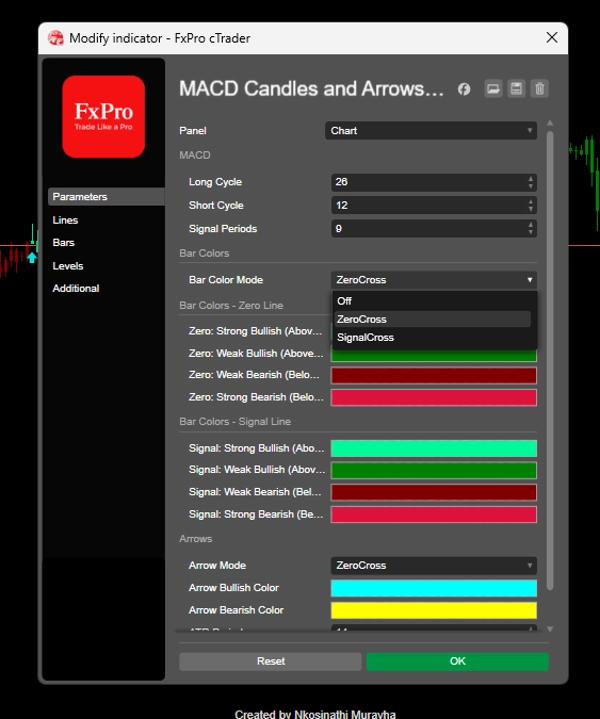
Świece są automatycznie kolorowane zgodnie z wybranym trybem.

Tryb Zero-Cross ocenia dwie rzeczy:

  • Czy histogram MACD znajduje się powyżej czy poniżej linii zerowej.
  • Czy momentum histogramu rośnie czy spada w porównaniu z poprzednim słupkiem.

Pozwala to traderom zobaczyć nie tylko aktualny kierunek, ale także czy momentum się wzmacnia czy słabnie.

2. Tryb Signal-Cross

Alternatywny tryb kolorowania świec porównuje linię MACD z jej linią sygnału i mierzy, czy odległość między nimi się zwiększa czy zmniejsza.

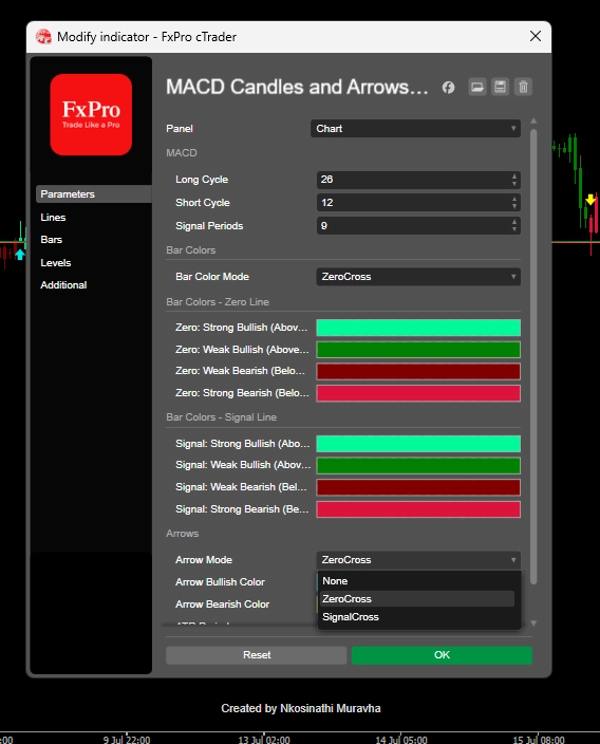
3. Strzałki handlowe

Wskaźnik może generować strzałki używając albo przecięć linii zerowej albo przecięć linii MACD/sygnału.


Trader może go używać do:

  1. Identyfikacji momentum byków i niedźwiedzi.
  2. Wykrywania przecięć linii zerowej lub linii sygnału MACD.
  3. Rozpoznawania, kiedy momentum się wzmacnia lub słabnie.
  4. Używania kolorów świec do potwierdzenia kierunku potencjalnej transakcji.
  5. Używania strzałek do podkreślenia potencjalnych zmian kierunku.
  6. Łączenia sygnałów z analizą cen, wsparciem/oporem, analizą trendu lub innymi metodami potwierdzającymi.

Podsumowanie

AI summary
MACD Candles and Arrows - Muravha is a momentum and trend-confirmation indicator that integrates MACD histogram analysis, signal-line crossovers, color-coded candles, and directional arrows into a single visual tool on the price chart. It offers two candle-color modes: Zero-Cross Mode, which evaluates whether the MACD histogram is above or below zero and whether momentum is rising or falling; and Signal-Cross Mode, which compares the MACD line with its signal line to assess the widening or narrowing distance between them. The indicator generates arrows based on either zero-line crosses or MACD/signal-line crosses to highlight potential directional changes. Traders can use this indicator to identify bullish and bearish momentum, detect MACD crossovers, recognize momentum strength or weakness, and confirm trade direction through candle colors and arrows. It is designed to complement other analysis methods such as price action, support/resistance, and trend analysis. The product supports visualization, filtering, and signal outputs based on bar data and is categorized under momentum indicators.
Profil wskaźnika
Kategoria wskaźnika
Dynamika
Typ wyjścia
Filtr
Sygnały
Wizualizacja
Wymagania dotyczące danych
Tylko słupki
Obsługiwane sygnały
Przecięcie
Przełamanie
Odwrócenie trendu

Opinie klientów

0.0
Opinie: 0
Opinie klientów
Ten produkt nie ma jeszcze opinii. Wypróbowałeś(-aś) go już? Bądź pierwszy(-a) i powiedz o tym innym!

Dyskusja

Częste pytania

MACD
Produkty dostępne za pośrednictwem cTrader Store, w tym boty handlowe, wskaźniki i wtyczki, dostarczane są przez deweloperów zewnętrznych i udostępniane wyłącznie w celach informacyjnych oraz w celu zapewnienia dostępu technicznego. cTrader Store nie jest brokerem i nie zapewnia doradztwa inwestycyjnego, nie udziela spersonalizowanych rekomendacji ani nie gwarantuje przyszłych wyników.

Więcej od tego autora

Wskaźnik
Prop
Forex
+12
Trend Riding Indicator
Wskaźnik
Ichimoku
Identifies Ichimoku cloud breakouts, trend direction, and momentum to highlight potential buy and sell opportunities.

Możesz także polubić

Wskaźnik
AI
ATR
+27
VWAP Sniper Elite -- Institutional Trend Engine
Wskaźnik
ATR
BOS
+5
Apex Strike: Multi-timeframe (M5-H1) non-repainting indicator with winrate dashboard & alerts (Gold, BTC).
Wskaźnik
RSI
SMC
+18
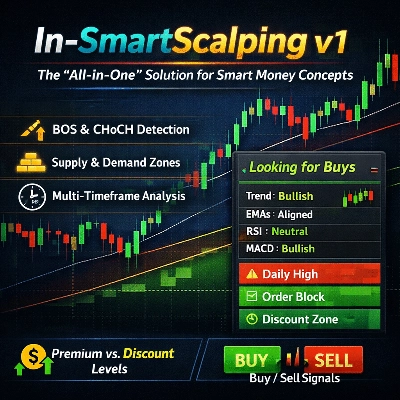
🚀 In - SmartScalping v1: The "All-in-One" Solution for Smart Money Concepts
Wskaźnik
ATR
Imbalance
+5
Chart analyzer, Multi time frame, hybrid strategies and timeframe
Wskaźnik
ADX
ATR
+3
Precision sniper-style confluence entries with graded signals, auto SL/TP & live backtest — 7 presets, MTF bias.
Wskaźnik
Pin Bar
Order Block
+5
Sierra Chart's Flex Renko Inverse, rebuilt for cTrader. Trends stay on one brick. Reversals print only when real.
Wskaźnik
Volume
Key Levels
+2
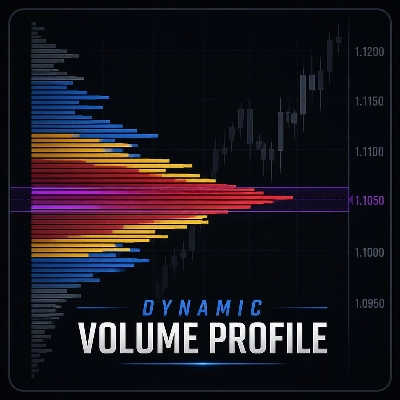
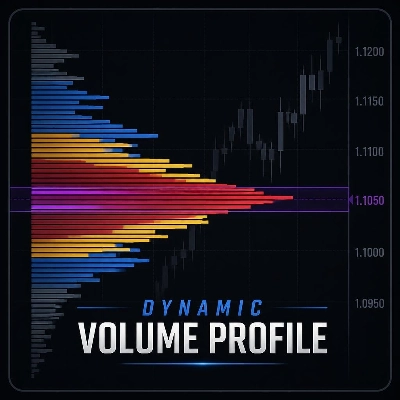
Fixed-range Volume Profile with customizable smoothing and colors for fast visual volume analysis. 
Wskaźnik
AI
ATR
+18
Advanced Level 2 market analysis tool.
Logo „Prometheus”
Najwyżej oceniane
4.0
(4)
$99
/
$179
Wskaźnik
AI
ATR
+15
AI-powered Smart indicator. Dual neural networks self-train on live trades. Liquidity sweep + SMC. All pairs/timeframe.
Wskaźnik
ADX
ATR
+5
HAI QUANTUM V7.0 | The Stochastic Drift & Gravity Edition The Most Advanced Neural-Ready Trading Dashboard for cTrader
Wskaźnik
Prop
Forex
+15
Footprint volume indicator showing bid/ask splits at each price level
Logo „BvsB 2026”
Najwyżej oceniane
4.7
(4)
$100
Wskaźnik
Prop
Forex
+1
Smart support/resistance indicator with rejection-only Buy/Sell signals designed for H1 charts.
Wskaźnik
BTCUSD
EURUSD
+7
Pure Market Structure, Catching the Algo of Institutional move, Stay in the Game !! & know what's gonna happen Next.
Wskaźnik
ATR
EMA
+3
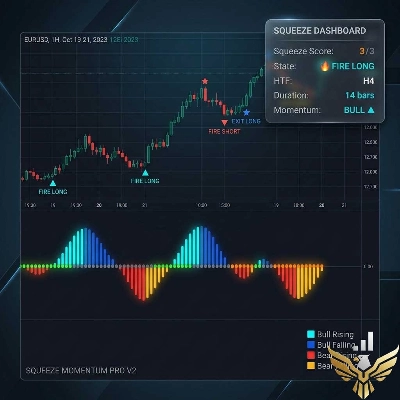
High-Tech 3-Level Squeeze Detection with HTF Filter, Carter Entry/Exit Rules, Signal Quality Grading & Real-Time
Logo „cAlgoBuddy - TDI Pro”
Najwyżej oceniane
4.7
(4)
od $19
Wskaźnik
RSI
Forex
+10
All in One indicator designed to reveal Market Sentiment.
Wskaźnik
Prop
Stocks
+4
High-Performance Renko Chart Indicator with Advanced filtering method - built for Renko and candlestick charts.
Wskaźnik
Volume
Supply & Demand
+1
Fixed-range Volume Profile with customizable smoothing and colors for fast visual volume analysis.
Logo „Phoenix SMC V5.2”
Najwyżej oceniane
4.7
(4)
od $19
Wskaźnik
SMC
VWAP
+5
Non-Repainting Logic All Signals Are Generated In Real Time And Remain Locked Once Printed. No Hindsight Adjustments.

Cena

4.14M
Wolumen transakcji
38.59K
Zysk w pipsach
1
Sprzedaż