Opis
Wskaźnik Wzoru Młota – Wyjaśnienie Strategii
Ten Wskaźnik Wzoru Młota to sygnał odwrócenia oparty na świecach, który identyfikuje bycze wzory młota w trendzie spadkowym. Został zaprojektowany, aby wykrywać potencjalne odwrócenia trendu i wskazywać okazje do kupna.
Jak to działa
1️⃣ Wykrywa trend spadkowy
- Cena zamknięcia świecy musi być niższa niż zamknięcie sprzed 3 świec, co wskazuje na potencjalny trend spadkowy.
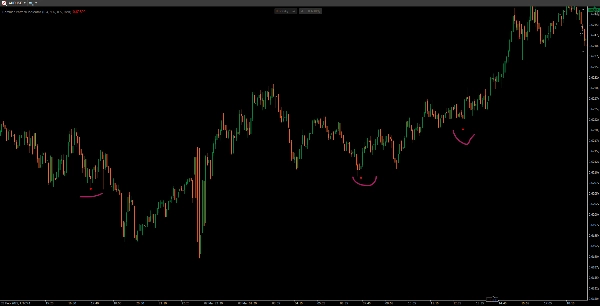
2️⃣ Weryfikuje strukturę świecy młota
- Małe ciało: Ciało świecy jest stosunkowo małe (≤ 30% całkowitego zakresu).
- Długi dolny cień: Dolny knot ma co najmniej 2-krotność rozmiaru ciała (wskazuje na silne odrzucenie niższych cen).
- Krótki górny cień: Górny knot ma ≤ 30% rozmiaru ciała (wskazuje na niewielki opór na górze).
3️⃣ Wyświetla sygnał kupna
- Jeśli wszystkie warunki są spełnione, pojawia się czerwona kropka (lub wybrany kolor) nieco poniżej minimum świecy młota jako wizualne potwierdzenie potencjalnego odwrócenia.
Kluczowe cechy
✅ Filtruje słabe sygnały, zapewniając wcześniejszy trend spadkowy.
✅ Dostosowywane parametry dla rozmiaru ciała, długości cienia i kolorów.
✅ Prosty, ale skuteczny wzór świecowy dla traderów swingowych i traderów akcji cenowej.
📌 Najlepsze zastosowanie: Potwierdź wzór młota dodatkowymi wskaźnikami (np. wolumen, poziomy wsparcia) dla silniejszych sygnałów! 🚀
Podsumowanie
Opinie klientów
5 | 100 % | |
4 | 0 % | |
3 | 0 % | |
2 | 0 % | |
1 | 0 % |