Descripción
Detector de Pin Bar – Descripción del Indicador
El Detector de Pin Bar identifica pin bars alcistas y bajistas, que son patrones de velas de reversión fuertes que se usan frecuentemente en el trading de acción del precio.
Cómo Funciona
1️⃣ Detecta Velas con Cuerpo Pequeño
- El cuerpo de la vela debe ser ≤ 25% del rango total (personalizable).
2️⃣ Mide la Longitud de las Mechas
- Pin Bar Alcista (Martillo):
-
- Cuerpo pequeño cerca de la parte superior del rango.
- Mecha inferior larga (≥ 60%) de la longitud total de la vela.
- Pin Bar Bajista (Estrella Fugaz):
-
- Cuerpo pequeño cerca de la parte inferior del rango.
- Mecha superior larga (≥ 60%) de la longitud total de la vela.
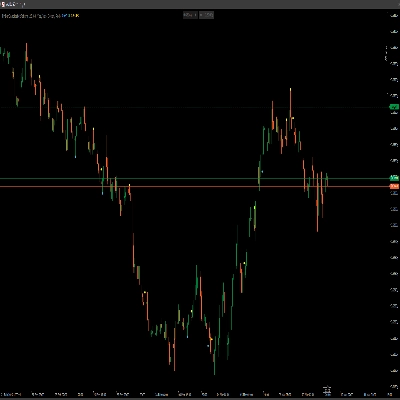
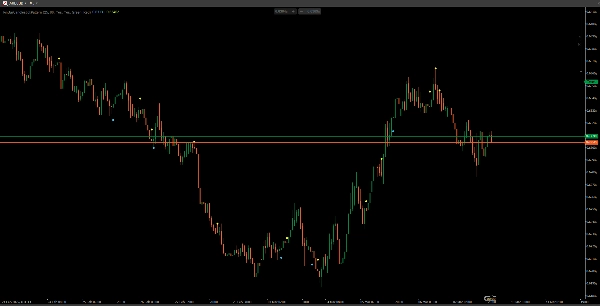
3️⃣ Muestra Señales de Compra/Venta
- Punto verde debajo de un pin bar alcista.
- Punto rojo encima de un pin bar bajista.
Características Clave
✅ Detecta reversiones alcistas y bajistas con parámetros personalizables.
✅ Funciona en cualquier marco temporal y mercado (Forex, Acciones, Cripto).
✅ Ayuda a los traders a identificar reversiones de alta probabilidad en niveles clave de soporte y resistencia.
📌 Mejor Uso: ¡Combínalo con análisis de tendencia, soporte/resistencia y volumen para una mejor confirmación! 🚀
Resumen
Valoraciones de clientes
5 | 100 % | |
4 | 0 % | |
3 | 0 % | |
2 | 0 % | |
1 | 0 % |