「CursorByte.SupportResistance v3」ロゴ
CursorByte.SupportResistance v3
5.0
レビュー: 1
「CursorByte.SupportResistance v3」アップロード画像
登録日 31/10/2024
44
販売
1.65K
無料インストール

***Improved version***

https://ctrader.com/products/2113
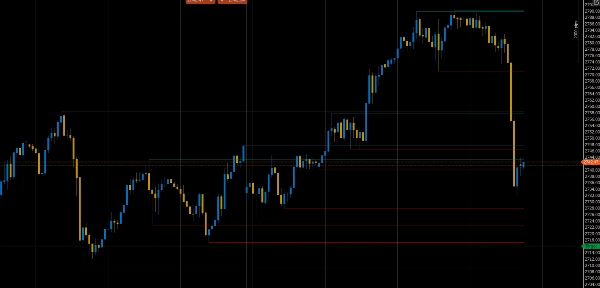
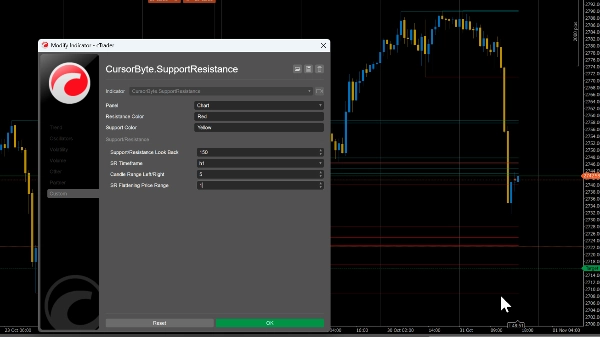

***********************


You can set the flattening price range based on the pair. Either 0.0001 for pairs like GU and 1.5 for Gold.

This indicator automatically identifies key support and resistance levels on the chart, helping traders spot potential reversal zones, breakout points, and areas of price consolidation for better entry and exit decisions.


NB: Use the flattening price range to reduce clutter on the chart (consolidate SR lines within a particular price range into one).


Indicator profile
5.0
レビュー: 1
5
100 %
4
0 %
3
0 %
2
0 %
1
0 %
カスタマーレビュー
August 12, 2025
Pros: Accurate auto SR levels, customizable design, stable performance. Cons: No significance filter, no auto-clear, possible chart clutter.
Breakout
Commodities
XAUUSD
Products available through cTrader Store, including trading bots, indicators and plugins, are provided by third-party developers and made available for informational and technical access purposes only. cTrader Store is not a broker and does not provide investment advice, personal recommendations or any guarantee of future performance.

この作成者の他の商品

Auto-detect support and resistance & trendlines, highlight pullbacks/BOS retests, and filter with candle confirmation.
Visual calendar with daily PnL, trades, win rate, profit factor, and performance insights.
Visualize trading volume by price within any range, highlight POC and key value areas.
Auto-detect support and resistance & trendlines, highlight pullbacks/BOS retests, and filter with candle confirmation.
Trade with clarity. Protect your capital. Let Risk Manager enforce the rules.
0%
最大ドローダウン
Apply Stop Loss and Take Profit to all positions and pending orders in one click.
A professional trading utility that displays real-time daily range statistics directly on your chart
Automatically plots Daily and Weekly Fibonacci retracements with smart redraw and session control.

これも好きかも

Our Advanced MACD Indicator is not just a simple histogram. This indicator is designed to provide a clear and dynamic...
Transform your approach to trading with our innovative Pivot Point Indicator.
VWAP Set to London Open
indicator showing the Daily Open Line and instantly shading bullish and bearish zones.
Awesome Oscillator with instant zero-line cross alerts. Includes chart popup + sound notification
Fair Value Gap (FVG) indicator identifies price inefficiencies in the market by highlighting gaps between candlesticks.
The "Market Temperature" Moving Average -Turn Your MA Into a Live Market Temperature Line
📊 Smart Floating Risk Pro – Advanced Risk Management for cTrader
Visual indicator for identifying momentum reversals. Designed for forex (1h) and stocks (weekly).
FREE Candlestick Pattern Recognizer
Price direction by calculating the probability of reaching new highs/lows. Shows levels & stats📈
Combines SMA with dynamic correlation to adapt to market trends. Adjusts sensitivity, filters noise🚀📉
E7 Correlation Dashboard.
Simple Smart Money Concepts (SMC)
Auto-swing detection driving 7 Fibonacci projections: retracement, expansion, fan, time, pitchfork, channel, Gann.
Volume distribution analysis with Market Profile TPO integration.
Unlock the true intent of market participants with the Classic Proportional Cumulative Volume Delta CVD!
This is a super indicator that integrates the RSI indicator with a dual moving average system.
登録日 31/10/2024
44
販売
1.65K
無料インストール