
Opis
Wskaźnik Łowienia Wielorybów – Akademia Bukhari
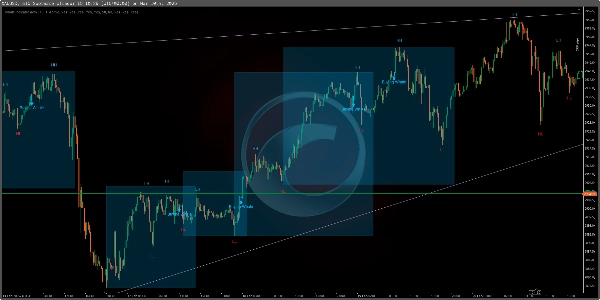
The Wskaźnik Łowienia Wielorybów to potężne narzędzie handlowe zaprojektowane specjalnie dla indeksów Boom & Crash oraz indeksów zmienności. Zawiera Automatyczny Detektor Trendów, wykrywa trend wzrostowy i spadkowy, oznacza punkty struktury rynku (HH, HL, LH, LL) oraz dostarcza wysokoprecyzyjne sygnały kupna i sprzedaży, aby pomóc traderom podejmować świadome decyzje.
Kluczowe funkcje:
✅ Automatyczny Detektor Trendów – Automatycznie identyfikuje trendy rynkowe, zmniejszając potrzebę ręcznej analizy.
✅ Zaprojektowany dla indeksów Boom & Crash oraz zmienności – Optymalizowany do handlu na tych rynkach syntetycznych.
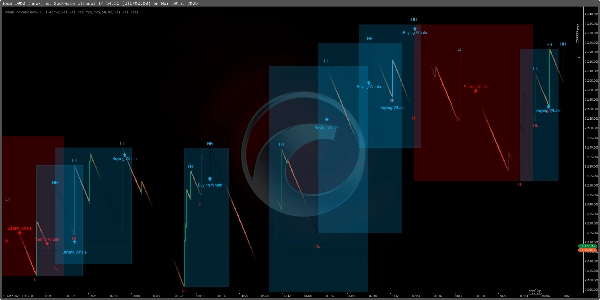
✅ Wykrywanie skoków na Boom & Crash (interwał M1) – Wykrywa potencjalne skoki na M1, pomagając traderom złapać szybkie ruchy cen.
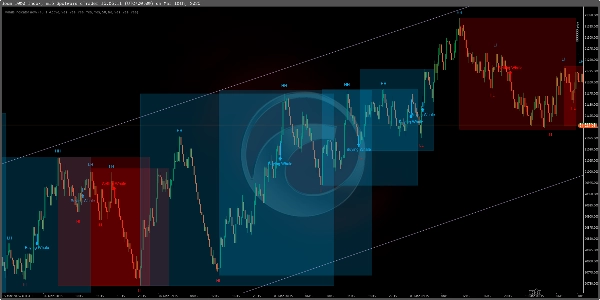
✅ Identyfikacja trendu na M15 – Skutecznie działa na M15 do normalnej analizy trendu i uporządkowanych ustawień handlowych.
✅ Analiza struktury rynku – Wyświetla Wyższe Szczyty (HH), Wyższe Dołki (HL), Niższe Szczyty (LH) i Niższe Dołki (LL) dla lepszego zrozumienia trendu.
✅ Sygnały wejścia Wieloryba – Podkreśla punkty "Kupującego Wieloryba" i "Sprzedającego Wieloryba" dla dokładnych wejść w transakcje.
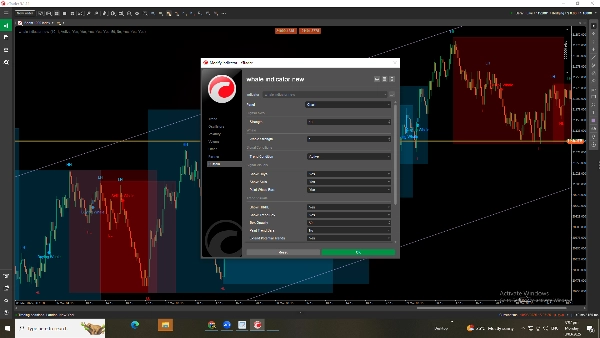
✅ W pełni konfigurowalne ustawienia – Dostosuj siłę wieloryba, czułość sygnału i warunki trendu, aby udoskonalić swoje podejście do handlu.
✅ Włączanie/wyłączanie funkcji – Przełączaj pola trendu, punkty struktury i sygnały kupna/sprzedaży według potrzeb.
Jak korzystać ze wskaźnika Łowienia Wielorybów?
1️⃣ Automatyczne wykrywanie trendu – Pozwól wskaźnikowi automatycznie określić kierunek trendu.
2️⃣ Handluj skoki Boom & Crash na M1 – Szukaj sygnałów na M1, aby efektywnie łapać skoki cen.
3️⃣ Analizuj trendy rynkowe na M15 – Używaj M15 do uporządkowanej analizy trendu i potwierdzenia transakcji.
4️⃣ Śledź strukturę rynku – Korzystaj z HH, HL, LH, LL, aby zrozumieć kierunek i siłę trendu.
5️⃣ Szukaj sygnałów Wieloryba – Wchodź w transakcje na punktach "Kupującego Wieloryba" lub "Sprzedającego Wieloryba".
6️⃣ Dostosuj dla dokładności – Reguluj siłę wieloryba i czułość sygnału, aby zoptymalizować wyniki.
7️⃣ Włączanie/wyłączanie funkcji – Modyfikuj warunki trendu i ustawienia struktury zgodnie ze swoją strategią.
Ten wskaźnik jest idealny dla indeksów Boom & Crash oraz zmienności, oferując wysokoprawdopodobne okazje handlowe z precyzją i efektywnością. 🚀
Podsumowanie
Key functionalities include spike detection on the M1 timeframe for Boom & Crash indices to capture rapid price movements, and trend identification on the M15 timeframe for structured trade setups. Users can customize settings such as whale strength, signal sensitivity, and trend conditions to refine their trading approach. Features like trend boxes, structure points, and buy/sell signals can be enabled or disabled according to user preference.
The indicator supports efficient analysis and trade execution in synthetic markets, offering tools for both short-term spike trading and longer-term trend analysis. It is suitable for traders focusing on Boom & Crash and Volatility indices who seek precise market insights and customizable signal options.
Opinie klientów
5 | 33 % | |
4 | 67 % | |
3 | 0 % | |
2 | 0 % | |
1 | 0 % |


