
VWAP Tabajara
Wskaźnik
438 pobrania
Wersja 1.0, Apr 2025
Windows, Mac
5.0
Opinie: 1
Opis
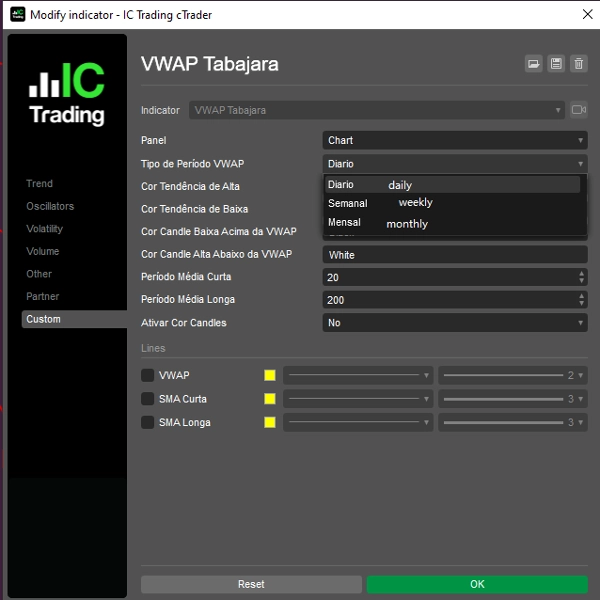
VWAP Tabajara
Podsumowanie
Podsumowanie AI
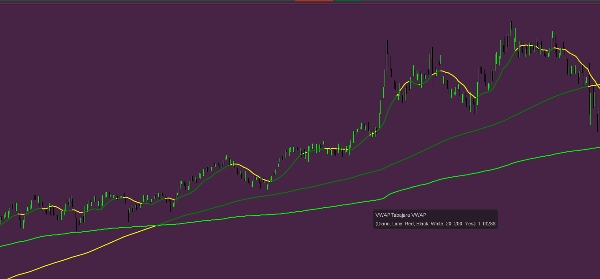
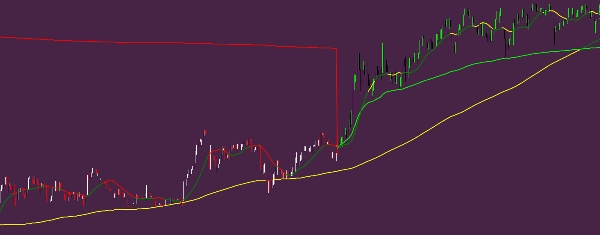
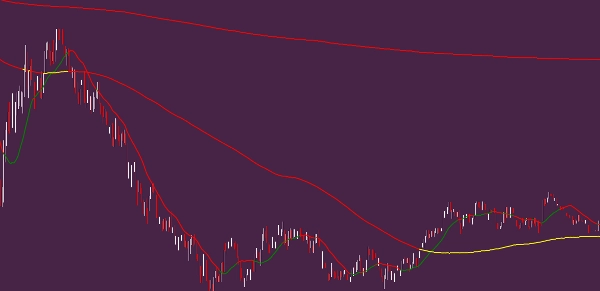
VWAP Tabajara is a trading indicator focused on the Volume Weighted Average Price (VWAP) metric. It provides traders with insights based on volume-weighted price data, which can be used to assess market trends and price levels. The indicator is designed to integrate into trading platforms, offering visual and analytical support for decision-making. VWAP Tabajara is categorized under volume indicators and is suitable for traders who utilize VWAP in their analysis.
Profil wskaźnika
Opinie klientów
5.0
Opinie: 1
5 | 100 % | |
4 | 0 % | |
3 | 0 % | |
2 | 0 % | |
1 | 0 % |
Opinie klientów
August 12, 2025
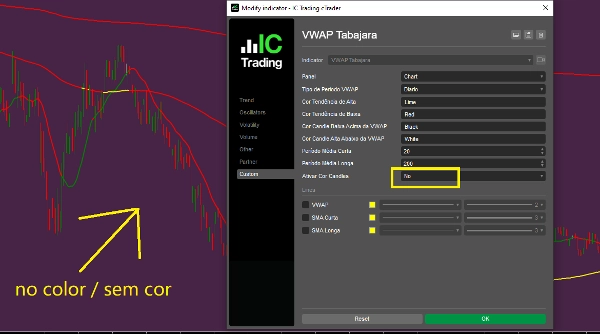
Pros: Accurate VWAP calculation with session reset, lightweight, stable on all timeframes. Great for intraday analysis. Cons: No alerts, no MTF mode, no preset saving.
Dyskusja
Częste pytania
VWAP
Produkty dostępne za pośrednictwem cTrader Store, w tym boty handlowe, wskaźniki i wtyczki, dostarczane są przez deweloperów zewnętrznych i udostępniane wyłącznie w celach informacyjnych oraz w celu zapewnienia dostępu technicznego. cTrader Store nie jest brokerem i nie zapewnia doradztwa inwestycyjnego, nie udziela spersonalizowanych rekomendacji ani nie gwarantuje przyszłych wyników.
Więcej od tego autora


![Logo „Tabajara corrigido[fix]”](https://cdn.ctrader.com/image/webp/7f4bbef8-b245-4ebd-80d7-582fffc0c90c_28378)


Cena
Od 10/02/2025
1.26K
Bezpłatne instalacje